Surveys are one of the few ways founders and product teams can hear from many users at once, yet they are often ignored or skimmed. Reading every response by hand is slow and prone to bias. With hundreds or thousands of replies, it becomes almost impossible. Modern tools can parse text and numbers, find themes and highlight patterns in minutes.
This guide shows you how to pair that speed with your own judgment. It covers how to design surveys that work well with machine tools, clean and prepare the results, use AI survey analysis responsibly, and turn numbers into stories. By the end you’ll know how to combine your experience with smart algorithms to make better product decisions.
Survey design and data collection
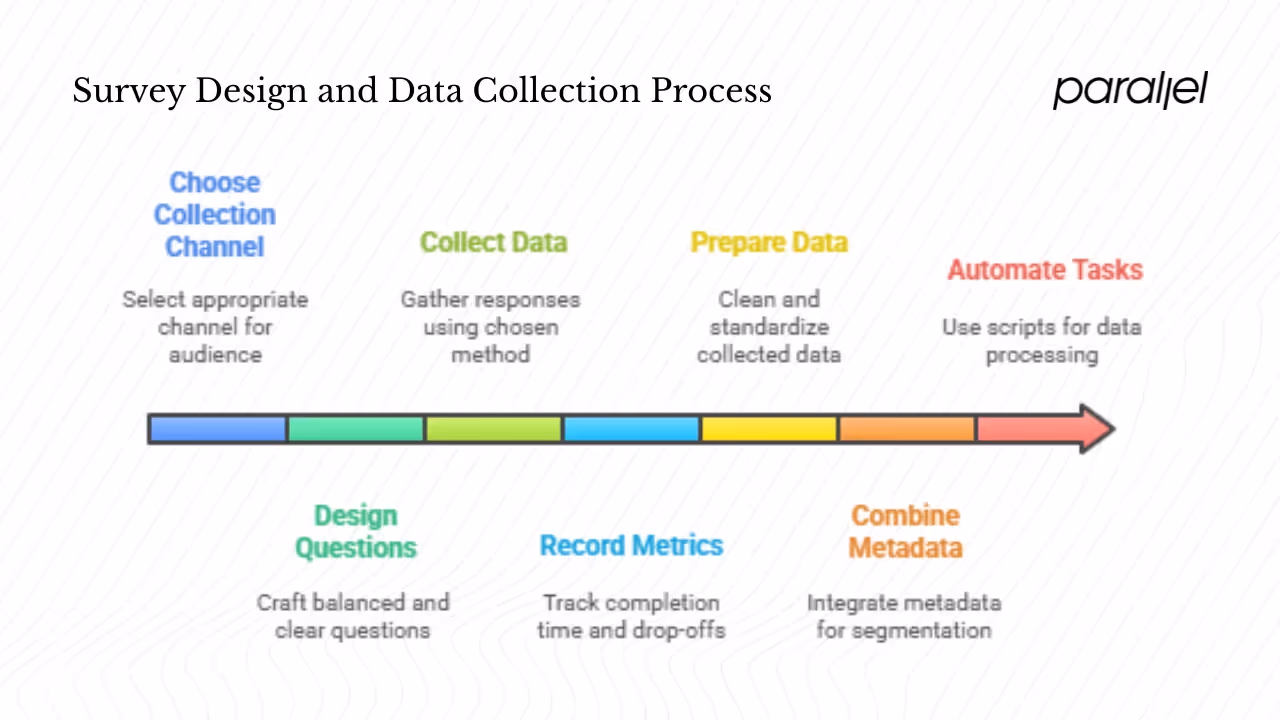
Collection methods and question design
Pick a channel that fits your audience. Web‑based questionnaires are cheap and quick, while in‑person sessions capture nuance but take more time. Panels can yield diverse samples but may attract professional responders. Recruiting users directly through your product helps with context but may introduce bias. Whatever route you choose, record completion time, drop‑offs and device type so you can later check for patterns.
Mix closed questions with open prompts to gather both numbers and stories. Balanced scales (such as five‑point satisfaction ratings) and consistent response formats make comparisons easy. Include logic branching to skip irrelevant items and attention checks to filter careless respondents. Allow space for a few free‑text responses; modern tools can extract themes and sentiment from them. Keep scales symmetrical and labels clear. Avoid ambiguous wording. Greenbook notes that language models can propose cleaner questions and flag unclear phrasing.
Data preparation
Tidy data is essential. Deduplicate entries, handle missing values and check for outliers. Standardize text encoding and categorical labels so that machines don’t misinterpret them. Combine metadata (such as segment or device type) with survey answers to enable meaningful segmentation later. Simple scripts in Python or Excel can automate these steps. When working with text fields, remove punctuation and convert to lower case. Good preparation makes machine‑assisted analysis smoother.
Core concepts in AI‑driven survey analysis
Defining machine‑assisted survey work
The term AI survey analysis covers the use of natural language processing, machine learning and statistics to read and interpret survey data. Algorithms can summarize answers, group similar comments and even predict future behaviors, but they should not replace your judgment. Researchers at the Nielsen Norman Group found that digital twins can fill in missing answers with about 78% accuracy yet struggle to handle new questions. Biases can creep in, especially when models rely on limited demographics. These results underscore the need for human oversight.
What machines do well—and what they don’t
Modern tools excel at crunching numbers: they calculate averages, build crosstabs and run tests in seconds. They cluster comments to surface common themes and can forecast behaviors like churn or upgrade propensity. They even draft charts and slide decks. Quirks Media highlights that such tools allow researchers to audit which tests were run and trace results back to raw data. However, models can overfit past data, leak information from test to train sets or hallucinate correlations. Keep humans in the loop, test models on holdout data and read a sample of raw responses to catch mistakes.
A step‑by‑step workflow from raw data to insights
Phase 1: Explore the basics
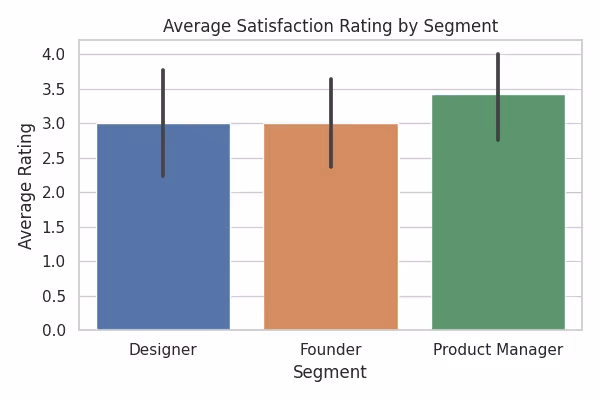
Start by running simple counts and averages. Compare results across segments using pivot tables, and plot distributions to spot anomalies. Summarize free‑text answers into short bullet points using a language model, but skim a few raw comments to retain context. In our sample dataset of 40 responses, the average satisfaction was a bit over three on a five‑point scale. A bar chart (Figure 1) helps you see which segment is happiest.
Phase 2: Extract themes
Next, look for patterns in qualitative answers. A simple approach is to use a list of positive and negative words to assign each comment a sentiment score. Our sentiment scores ranged from –1 to 2, with an overall average near zero. For larger surveys, clustering or topic modeling can group similar comments into themes. Tie these themes back to numeric results: if low‑satisfaction respondents often mention “slow performance,” you know where to focus.
Phase 3: Build simple models
You can then explore predictive models to see which variables influence behaviors. For example, we built a basic logistic regression to estimate whether someone might upgrade based on their segment, usage frequency, rating and sentiment. It showed that being a founder was associated with a higher likelihood to upgrade. Advanced models like random forests or gradient boosting can reveal non‑linear patterns but should always be tested on unseen data.
Phase 4: Tell a story
Finally, turn statistics into actions. Link findings back to survey goals and business priorities. Highlight the most impactful themes, and use visuals to make the story clear. Tools like Julius.ai can generate charts from a spreadsheet, but review the underlying numbers. In our dataset, designers were happiest on average, suggesting the product resonates well with them. Combined with sentiment and upgrade predictions, this guides where to invest next.
Tools and platforms for AI‑powered survey insights
Many vendors now offer AI survey analysis features out of the box. Julius.ai lets you upload a spreadsheet and ask questions in plain language; it computes means, correlations, predictive models and drafts charts. SurveyMonkey’s “Genius” flags unclear questions and summarises responses. BlockSurvey emphasises privacy and secure text analysis. Sprig, Blix.ai and similar tools focus on continuous research and interactive dashboards. Large language models like ChatGPT’s Advanced Data Analysis can also process survey data and write code on request. These options speed up exploration, but their methods are opaque: you often cannot see which tests were run or adjust the models. Use them to accelerate analysis, then verify results yourself and supplement with dedicated statistical tools when necessary.
Real examples and cautionary tales
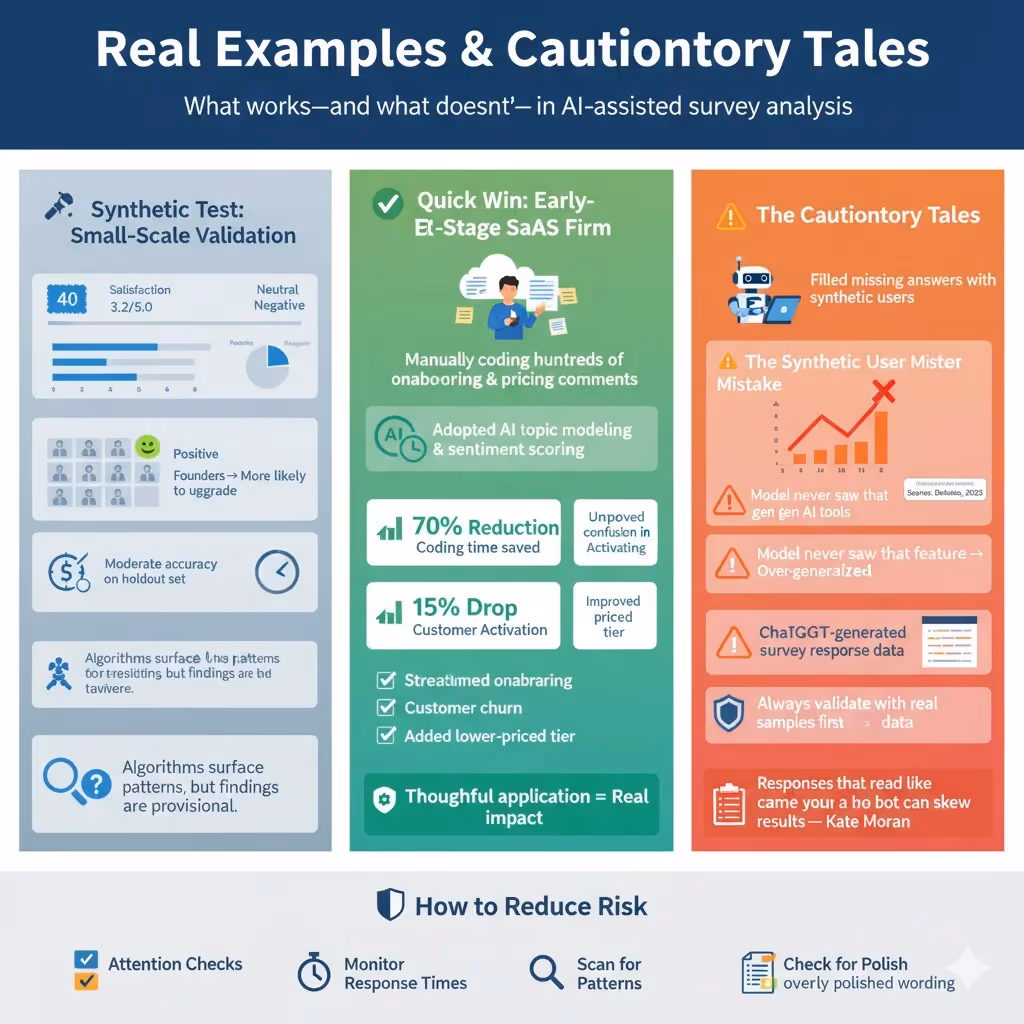
Real examples show both the potential and the limits of machine‑assisted survey work. In a synthetic test with 40 responses we cleaned the data, calculated a mean satisfaction just over three on a five‑point scale and assigned simple sentiment scores. Designers were happiest. A basic predictive model hinted that founders were more likely to upgrade than other segments, but its accuracy on a hold‑out set was only moderate. This illustrates that algorithms can surface patterns, yet their findings are provisional.
Teams can achieve quick wins when they apply tools thoughtfully. At one early‑stage SaaS firm we helped, researchers manually coded hundreds of onboarding and pricing comments. By adopting AI survey analysis methods—using automated topic modeling and sentiment scoring rather than hand coding— they cut coding time by about 70% and uncovered confusion around the initial setup flow. They streamlined onboarding and offered a lower‑priced tier; churn fell by 15% and activation rose.
Missteps occur when over‑trusting models. One company tried to fill missing answers with synthetic users; when they queried a new feature, the predicted adoption was 30% higher than what real users later reported. Because the model had never seen that feature over‑generalised. They learned to validate model output with small samples before acting.
Ethical challenges are emerging too. More participants are using generative tools to answer surveys. Deloitte found that 53% of US consumers experimented with such tools in 2025, up from 38% in 2024. Kate Moran has seen ChatGPT‑generated responses in diary studies. Responses that read like they came from a bot can skew results. To reduce risk, include attention checks, monitor response times and scan for repetitive, overly polished wording.
Best practices and trade‑offs
Seasoned practitioners follow a few guidelines to get the most from machines. Always keep a human in the loop: skim a sample of raw comments, cross‑check model predictions on a hold‑out set and rerun any surprising correlations manually. Treat survey analysis as an iterative process. Each round of findings should feed back into better questions and models; as sample sizes grow, you can introduce more advanced techniques. Choose metrics that matter—statistical significance is only useful when coupled with business impact. Respect privacy by collecting only essential data and anonymising identifiers. Communicate uncertainty honestly with confidence intervals and error bars. Finally, scale cautiously: move from spreadsheets to automated pipelines as volume grows, but never hand over decisions entirely to algorithms. As Kate Moran notes, AI tools are like interns who need supervision.
Looking ahead
The next wave of AI survey analysis will involve richer data and adaptive instruments. Conversational surveys, where a chatbot asks questions and probes for clarification, are already emerging. Greenbook notes that a large language model‑based interviewers can reorder questions to increase completion rates; a fintech team saw a 22% lift by prioritizing emotionally engaging content early. Future systems may integrate product usage logs or behavioral analytics with survey responses, enabling deeper segmentation. They may also trigger follow‑up questions automatically when a metric drops or when new themes appear in feedback. With these advances come new ethical challenges around transparency, consent and fairness.
Conclusion
Survey data is one of the few direct channels to hear from many users at once. Combined with modern tools, it becomes a strategic asset. This guide has outlined how to design surveys that machines can parse, clean and prepare data, apply AI survey analysis techniques responsibly, and translate results into decisions. Key takeaways include:
- Design with clarity and balance: avoid ambiguous phrasing and keep scales consistent. Use open prompts to capture stories.
- Clean your data thoroughly before analysis. Join metadata and standardize labels.
- Use machines for what they do best—statistics, pattern detection, predictions—but keep a human in the loop. Validate models and watch for bias.
- Build a workflow: start with exploratory stats, extract themes, model behaviors and craft a narrative with charts and context.
- Choose the right tool: dedicated platforms like Julius.ai and SurveyMonkey’s Genius are convenient, while DIY analysis with a language model offers flexibility. Always verify results.
AI survey analysis is not magic; it’s a discipline that blends rigorous research methods with modern tools. Start with small experiments. As your team grows more comfortable, scale your analyses and refine your questions. Most importantly, treat machines as assistants. As Kate Moran said, they are like interns—you must provide context and oversight. By combining your expertise with the speed and scale of AI survey analysis, you can make smarter product decisions and serve your users better.
FAQ
1) How do you analyze survey results with AI?
Begin by cleaning your dataset and computing basic statistics. Use language models to summarize open responses and detect themes. Apply machine learning algorithms—such as logistic regression or clustering—to predict behaviors or segment users. Visualize the results and always validate them with human review.
2) Can ChatGPT analyze survey data?
Yes. Tools like ChatGPT’s Advanced Data Analysis allow you to upload spreadsheets and ask for summaries or code. It can perform descriptive statistics, generate charts and even write Python scripts. However, you must check the outputs, fix any mistakes and ensure the methods match your goals.
3) Is there an AI that can analyze data?
Multiple platforms provide AI‑driven data analysis. Julius.ai lets you query spreadsheets with natural language. SurveyMonkey offers auto‑analysis and sentiment scoring. Dedicated tools like Displayr focus on survey analytics. These solutions speed up analysis but always require human oversight to ensure accuracy and relevance.
4) How is AI used in surveys?
Machine intelligence assists at every stage: generating unbiased questions, optimizing survey flow, summarizing text responses, identifying themes and predicting future behaviors. Some tools even trigger follow‑up questions in real time. Still, human researchers design the study, interpret the findings and make final decisions.

check out these related blogs