Picture this: you and your team have just wrapped up ten in‑depth conversations with people who use your product every day. The table is littered with sticky notes, your recorder is full of audio files and there are pages of transcript waiting on your desk.
As a founder or product manager, the temptation is to skim through a few quotes, pick out your favourite stories and move on. But that would be leaving so much value on the table. The real impact of research comes from what happens after the interview.
In this guide I’ll share how to analyze user interviews so you can turn voices into direction. You’ll find frameworks, step‑by‑step tactics and lessons from our own projects at Parallel to help you go from raw data to insights you can act on.
What is “user interview analysis” (vs synthesis)?
When we talk about analysing interviews we mean the process of classifying, organising and transforming raw qualitative data into meaningful units. Maria Rosala of Nielsen Norman Group defines thematic analysis as a “systematic method of breaking down and organising rich data … by tagging individual observations and quotations with appropriate codes”. Themes emerge when related findings appear repeatedly across participants. This analytical phase is distinct from synthesis. Analysis is about labelling and grouping what you heard; synthesis is about weaving those findings into a coherent story and making recommendations. Both steps matter, but analysis is the foundation. Without it you’re just rearranging anecdotes.
Analysis sits alongside other research activities. Interviews provide context and texture, surveys add scale and analytics give behavioural evidence. Combining them through synthesis yields a more complete picture, but only if you handle each data source properly. In our projects at Parallel we often share a first‑pass analysis with clients before moving to synthesis so they can see the raw patterns themselves.
When and how early you should plan your analysis
The best time to think about analysis is before you speak to your first participant. Knowing your research objectives up front helps you set up your interview guide and plan how you will segment the data later. If you wait until all the interviews are done, important context fades and momentum drops. We often add a thirty‑minute “sensemaking” slot after each session to jot down immediate impressions; those quick reflections become invaluable when we start to code and group later.
There are two common ways to structure your analysis schedule:
- Batch analysis: You analyse interviews in small batches (e.g., after every three sessions). This keeps the workload manageable and allows you to adjust your questions if you notice gaps.
- All‑at‑once analysis: You collect all the data first and then analyse everything together. This can be efficient if you have dedicated analysis time and a clear framework, but there’s a risk of overwhelm.
Common challenges and pitfalls
Qualitative research produces long transcripts and detailed notes. Rosala notes that large quantities of data can be time‑consuming to read and you may struggle to see patterns or recall what’s important. Without a systematic process, analysis can become a superficial regurgitation of what participants said. Common pitfalls include:
- Confirmation bias: seeing what you expect to see. We’ve caught ourselves highlighting comments that support our hypothesis while ignoring contradictory feedback.
- Losing sight of objectives: If you don’t revisit your research questions, you might spend hours coding tangential stories.
- Treating all data equally: Not every response is equally relevant. Pay more attention to experiences that align with your goals or that come from your target personas.
- Jumping to conclusions: It’s easy to leap from one quote to a solution. Resist that urge. A coded dataset gives you a solid basis for later synthesis.
Pre‑analysis setup
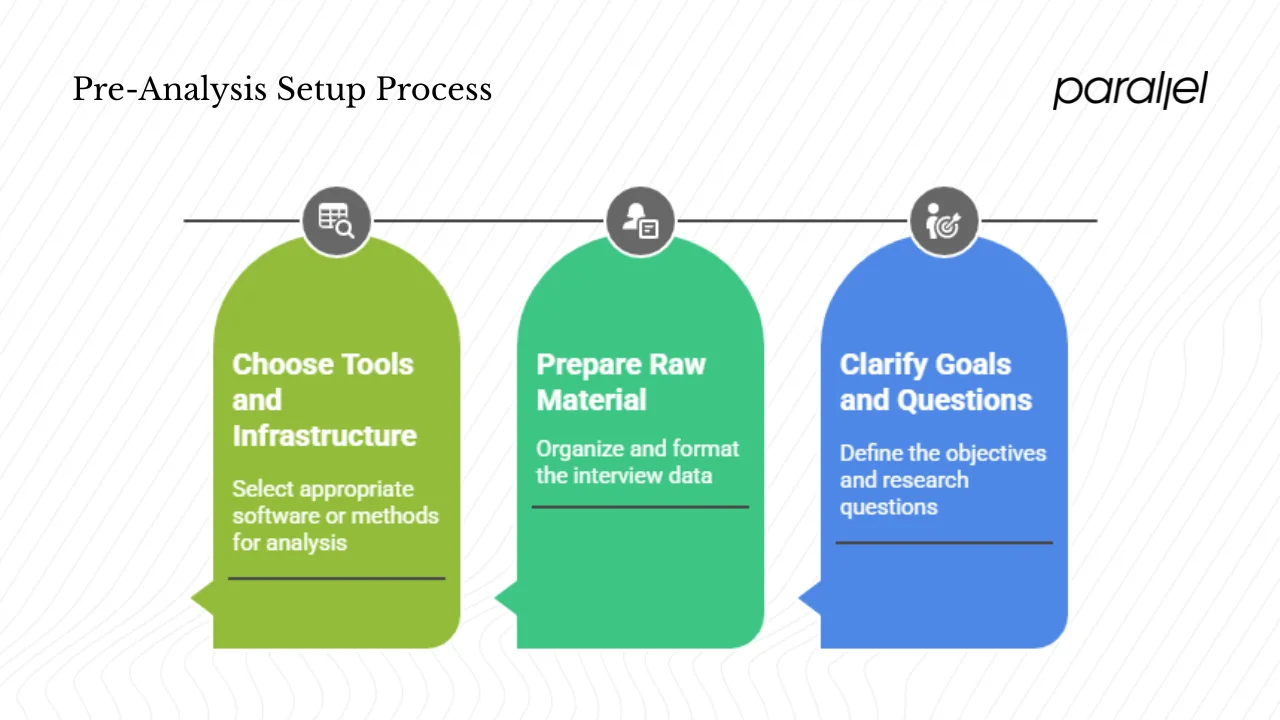
1) Clarify your goals and research questions
Before you touch the transcripts, revisit why you ran the interviews. Are you exploring onboarding pain points? Looking for unmet needs in a workflow? Your analysis lenses should reflect those goals. For instance, when we worked with an AI‑driven productivity platform we created separate lenses for first‑time setup, daily habit formation and integration with existing tools. This helped us focus our coding and prevented scope creep.
Writing down your research questions also serves as a checklist during analysis. If a quote doesn’t help answer a question, consider leaving it uncoded or adding it to a “parking lot” for later exploration.
2) Prepare and organise your raw material
Getting your data into a consistent format makes analysis faster. Here’s how we approach it:
- Transcribe interviews. You can transcribe manually (slower but accurate) or use automated tools such as Otter or Descript. Always review automated transcripts; they often mis‑label speakers or miss non‑verbal cues.
- Capture mini summaries. Immediately after each session, write a brief snapshot of what stood out—surprises, pain points, quotes. This keeps your gut reactions alive for later.
- Clean and structure transcripts. Ensure each speaker is labelled and timestamped. Break the text into utterances (one idea per line) to make coding easier.
- Collect metadata. Participant attributes (e.g., role, tenure), session notes and contextual factors (background noise, technology issues) provide important context when interpreting themes.
3) Choose your tools and infrastructure
The right tools can speed up analysis. Many UX researchers use software platforms such as Dovetail, Notably, NVivo or Condens; these allow you to upload transcripts, apply codes and link quotes back to themes. The Nielsen Norman Group notes that such software supports thorough, collaborative analysis but can require learning and costs. If you prefer low‑tech methods, a simple spreadsheet works. Each row can represent an utterance with columns for codes, notes and participant attributes.
Affinity mapping boards (digital or physical) are great for grouping codes. When we facilitate client workshops we often print quotes on sticky notes, ask stakeholders to sort them into clusters and then label the clusters. Maintaining a codebook—a running list of code names, definitions and examples—ensures consistency. Make sure your system provides version control and traceability; you should be able to link every insight back to a specific quote or session.
Core process: from text to themes
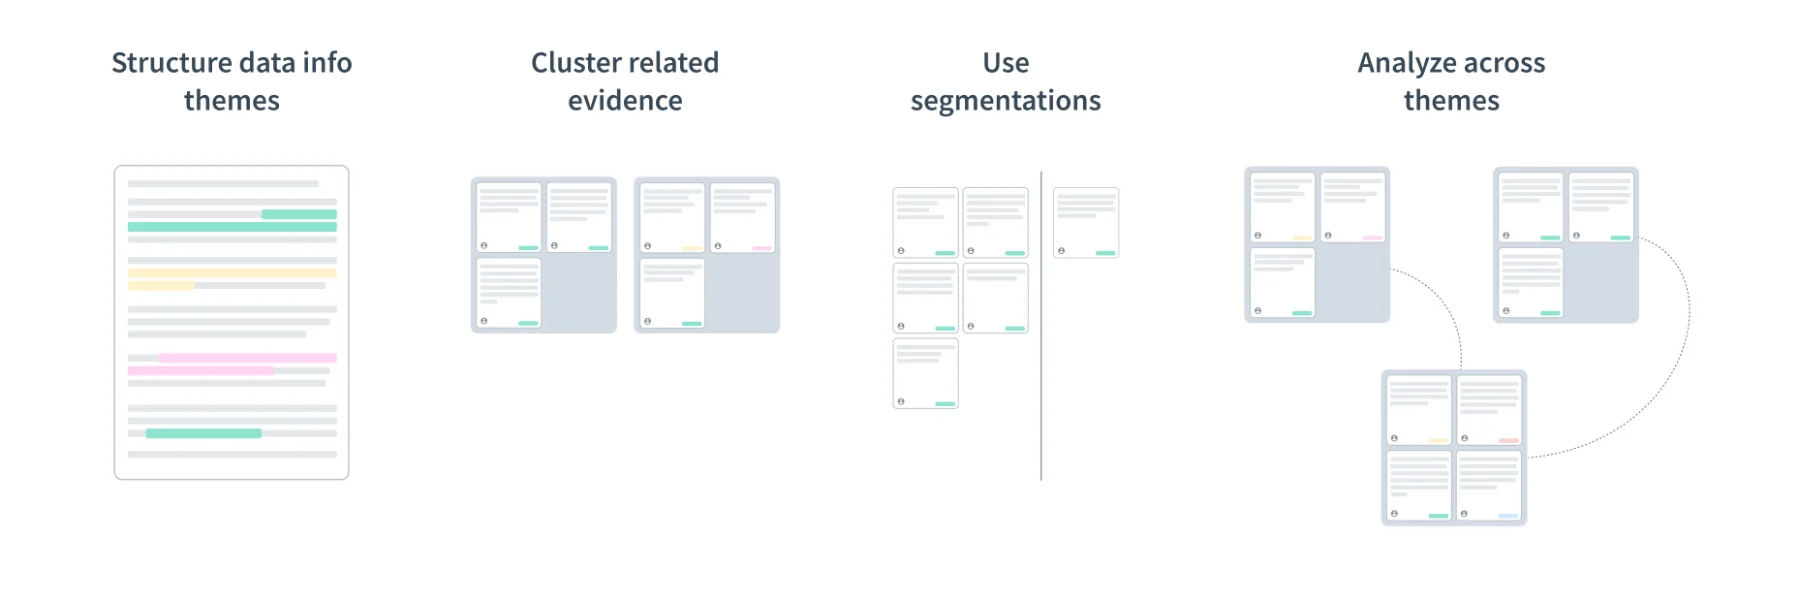
The core of how to analyze user interviews involves moving from unstructured words to structured insights. Below is our recommended process, with an illustration to show the flow from raw data to themes and insights:
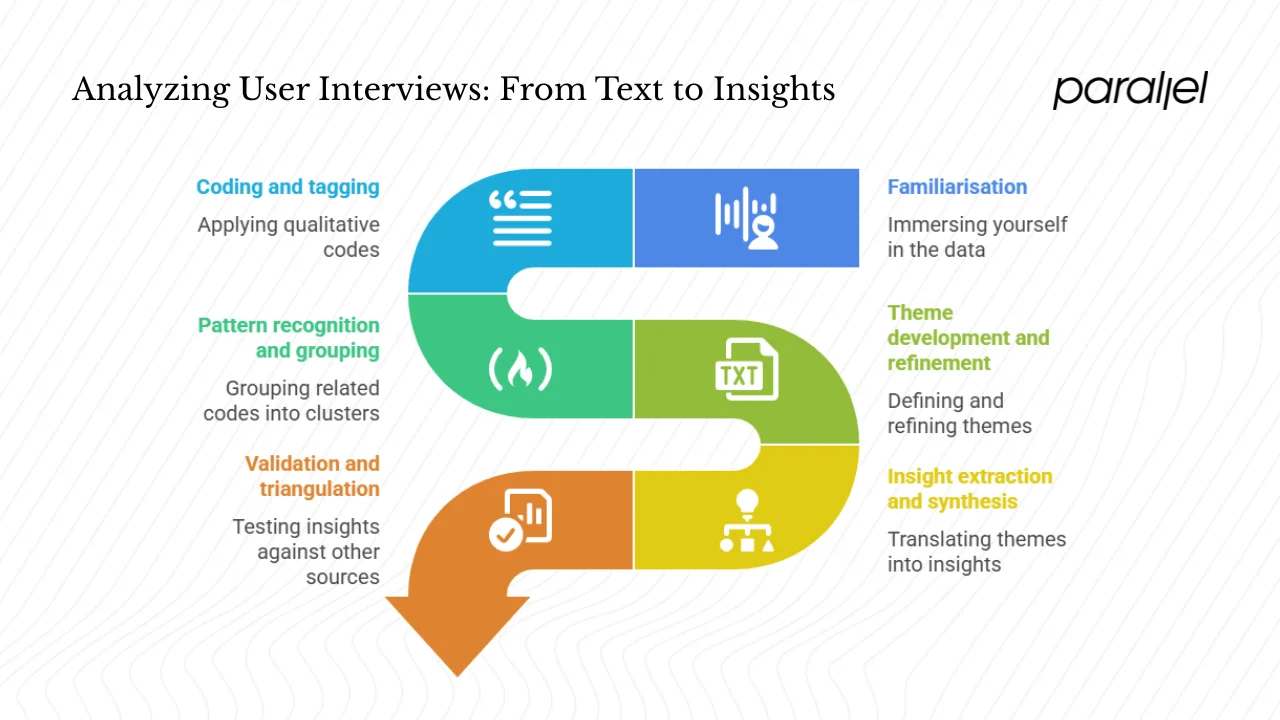
1) Familiarisation: immersing yourself in the data
Start by reading and re‑reading each transcript. Listen to the recordings while following along. Highlight interesting quotes, surprises and puzzles. At Parallel we like to do a first pass individually and then discuss as a team—different perspectives often surface nuances one person might miss. Use your mini summaries to recall your initial reactions and compare them with what the transcripts reveal.
2) Coding and tagging: applying qualitative codes
Coding means attaching short labels (codes) to segments of data. UXtweak describes qualitative coding as “labeling and organising raw text‑based data so that you can identify themes, patterns and insights”. There are two main approaches:
- Inductive (open) coding: Let codes emerge from the data itself. This is useful when exploring a new problem space because you aren’t constrained by preconceived notions.
- Deductive coding: Start with a predefined list of codes based on your research questions or previous studies. UXtweak notes that deductive coding begins with a list of codes drawn from your goals or past studies.
During coding, be as granular as necessary. We often code at the sentence or phrase level. If multiple participants mention similar pain points—“I couldn’t find the settings,” “The navigation is confusing”—we might apply a single code like navigation frustration to capture that cluster. Maintain consistency by using a shared codebook. When you notice two codes are overlapping, merge them; if a code becomes too broad, split it. Version control helps you keep track of changes.
3) Pattern recognition and grouping
Once you’ve coded your transcripts, the next step is to look for patterns. Group related codes into clusters using affinity mapping. For example, codes such as navigation frustration, hidden features and unclear labels might roll up into a broader cluster like usability issues. Look for recurring phrases, metaphors or emotional reactions. Check for co‑occurrences—do certain codes frequently appear together? When we analysed interviews for a SaaS onboarding flow, we noticed that confusing pricing often co‑occurred with hesitation to upgrade, suggesting that unclear cost structures were blocking conversion.
4) Theme development and refinement
Themes are broader constructs that capture what is happening across multiple interviews. According to Rosala, a theme describes a belief, practice, need or phenomenon that emerges when related findings appear multiple times across participants. Define each theme clearly: what does it capture and what does it exclude? You may discover subthemes and hierarchies—usability issues might break down into navigation, error messaging and visual hierarchy. Iteratively revisit transcripts and codes to validate your themes. Theme saturation occurs when new interviews no longer produce new themes. At this point you can decide on a final theme set.
5) Insight extraction and synthesis
The step where analysis turns into value is synthesis. Translate themes into insights by asking, “What does this tell us about user needs, behaviours or opportunities?” Prioritise insights by their impact and feasibility. Use narrative devices—personas, story arcs, journey maps—to bind insights into a story that stakeholders can follow. Link each insight to product or roadmap decisions. For example, if multiple users struggle with account setup due to information overload, an actionable insight might be “Simplify onboarding with progressive disclosure,” which then informs design priorities.
6) Validation and triangulation
Qualitative insights should be tested against other sources. Cross‑check your themes with behavioural analytics, survey data or customer support logs. Share early insights with teammates, stakeholders or even participants to get feedback. Be sensitive to contradictory data; deviant cases often reveal blind spots. In our work we’ve seen that presenting rough themes to engineers early leads to valuable context and prevents misinterpretations later.
Deliverables and communication
Analysis isn’t complete until you communicate findings effectively. Consider these deliverables:
- Insight decks or reports: Structured presentations that outline your research questions, methods, themes and recommendations. Each insight should be accompanied by supporting quotes or metrics.
- Highlight reels: Short audio or video clips tied to themes. Hearing users in their own words can be more persuasive than reading transcripts.
- Visual artefacts: Affinity maps, journey maps or code maps help stakeholders understand relationships between themes. Visualising the path from raw data to insights builds trust.
- Atomic insights: Bite‑sized findings stored in a repository for future reference. Many teams maintain a searchable database of nuggets so that research doesn’t disappear.
How to tell the story
Start with your key questions and high‑level insights. For each insight, show the evidence—quotes, counts of coded occurrences, patterns. Walk your audience through the journey from quotes → codes → themes → insights → recommendations. Use a narrative arc: present the problem, build tension with evidence and resolve it with design or product actions. Tailor the story to your audience: founders care about strategic direction, while engineers appreciate clear problem statements and solution rationale.
Engaging stakeholders in analysis
Analysis is more powerful when it’s collaborative. Invite stakeholders to join coding sessions or clustering workshops. Not only does this build buy‑in, it also brings diverse perspectives. The 2025 State of UX Research Democratization report found that 74.1% of research professionals support democratizing the execution of UX studies and 95% support democratizing internal access to research repositories. Even manual synthesis received support from half of respondents. In our experience, involving product managers and engineers early helps them see the nuance in user feedback and reduces resistance when recommendations challenge assumptions.
Best practices, tips and common pitfalls
Over years of running studies for early‑stage startups and AI/SaaS teams, we’ve developed a list of practices that keep analysis rigorous and actionable:
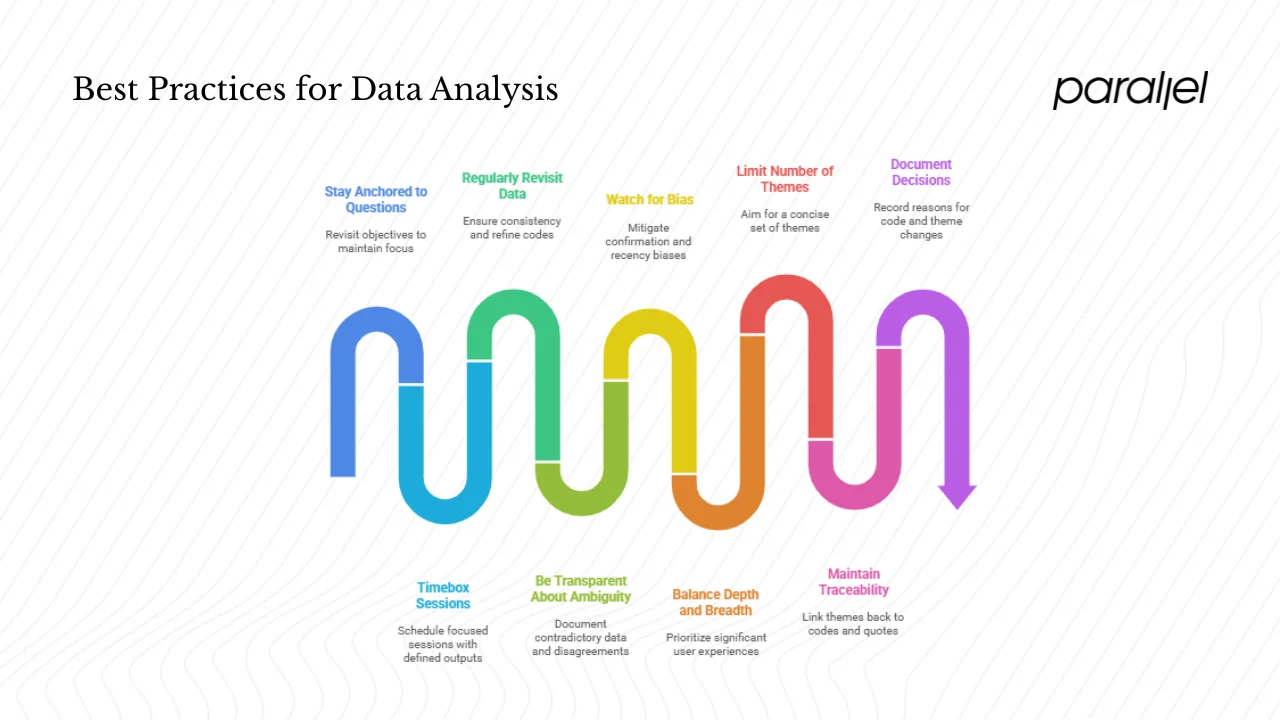
- Stay anchored to your questions. Revisit your objectives often. If you find yourself coding anecdotes that don’t answer them, pause.
- Timebox your sessions. Analysis can expand indefinitely. Schedule focused sessions with defined outputs (e.g., “code one transcript” or “cluster codes for onboarding theme”).
- Regularly revisit earlier data. As themes evolve, go back to earlier transcripts to ensure consistency and refine codes.
- Be transparent about ambiguity. Document where the data is contradictory or where your team disagreed. Showing uncertainty can build trust.
- Watch for bias. We’re all susceptible to confirmation bias, recency bias and cherry picking. A shared codebook and peer review help mitigate these risks.
- Balance depth and breadth. Not every utterance needs coding. Prioritise segments that relate to your questions or represent significant user experiences.
- Limit the number of themes. Too many themes dilute focus. Aim for a concise set that captures the essence without fragmentation.
- Maintain traceability. Link every theme back to the codes and quotes it came from. This makes it easier to justify recommendations and revisit decisions later.
- Document decisions. Record why you merged codes or split themes. Future you—and your team—will thank you.
Tools and resources (optional appendix)
Here’s a non‑exhaustive list of tools that can help with analysis. Choose what fits your workflow, budget and team structure.
| Purpose | Example tools | Notes |
|---|---|---|
| Qualitative analysis platforms | Condens, Dovetail, Notably, NVivo, Atlas.ti | Support collaborative coding, tagging and traceability. May require licenses and training. |
| Transcription | Otter.ai, Descript, Rev | Automated services save time but review for accuracy. |
| Affinity mapping | Miro, Mural, physical boards | Useful for clustering codes and themes visually. |
| Codebook & version control | Spreadsheets, research repositories | Maintain definitions, examples and revision history. |
| Further reading | Nielsen Norman Group article on thematic analysis; Dovetail’s step-by-step guide; UXtweak’s coding guide | Deepen your understanding of analysis techniques and compare approaches. |
Conclusion
Conducting user interviews is only half the job; analysis turns conversations into insight and action. A deliberate, systematic approach to how to analyze user interviews will help you avoid the common traps of qualitative research and extract value from every transcript. Start with clear goals, prepare your data well, then move methodically from coding to themes to insights.
Involve your team early, embrace the messy nature of qualitative work and document your decisions. The adoption of AI tools is accelerating—78% of organisations used AI in at least one business function in 2024, up from 55% a year earlier—but human judgment remains essential. Treat analysis as a craft and you’ll uncover opportunities that spreadsheets alone could never show.
As you apply these methods, consider your context. Startups operate at pace, but taking the time to analyse interviews properly can save weeks of building the wrong thing. Keep your team curious, invite diverse perspectives and let the voices of your users guide you. I hope this guide helps you build more empathetic and effective products. Reach out if you’d like to trade stories about messy research, tricky themes or satisfying light‑bulb moments.
FAQs
1) How do you analyse user interview data?
Our process involves transcription, familiarisation, coding, grouping, theme development and insight extraction. Start by getting the words on paper, immerse yourself in the data, assign codes using inductive or deductive methods, cluster codes into patterns, refine those patterns into themes and then interpret what those themes mean for your product. Keep track of your decisions and link every insight back to supporting quotes. This approach mirrors the thematic analysis process described by Nielsen Norman Group and the seven‑step framework outlined by Dovetail.
2) How do you analyse data from interviews?
The method is similar regardless of whether interviews are about your product or a broader topic: turn spoken responses into text, segment them into meaningful units, label those segments with codes, look for patterns and themes and interpret those themes in light of your research questions. Use inductive coding to discover new themes or deductive coding when you have predefined categories.
3) How should you structure user interviews?
Before analysis, design your interview guide thoughtfully. Use semi‑structured questions that start broad and then probe deeper. Include prompts to explore unexpected topics. Begin with an icebreaker, move through core questions and finish with a wrap‑up. Record the session (with consent) and take notes. A well‑structured interview makes transcription and analysis much easier.
4) How do you analyze user testing results?
User testing often combines qualitative feedback with quantitative metrics. Transcribe think‑aloud protocols, code behavioural comments, cluster usability issues and identify friction themes. Cross‑reference qualitative themes with quantitative measures such as completion rates or error counts. This mixed‑methods approach helps prioritise what to fix and provides evidence for your decisions.

check out these related blogs


.avif)