When you’re running a young product team there’s one basic question that comes up again and again: are people succeeding when they try to do something with your product? The clearest way to answer it is by working out the success rate, a fraction that shows how many attempts end well compared with how many were made. As The Bricks data guide puts it, a success rate is “a simple percentage calculation” — it divides the count of successes by the total attempts. In this piece I’m going to explain what success rate means, why it’s useful for founders and product leaders, how to calculate success rate in a variety of situations, and how to improve it.
situations, and how to improve it.
How to calculate success rate?
To calculate success rate, divide the number of successful outcomes by the total number of attempts, then multiply by 100.
Step‑by‑step calculation
To work out a success rate reliably, follow these steps:
- Decide what counts as “success”. Be precise. Are you counting only clean completions, or do assisted and partial outcomes qualify too?
- Record the total number of attempts. This is your denominator. It might be users who saw a prompt, people who started a flow, or tasks assigned in a test.
- Count how many ended in success. This is your numerator. Only include attempts that meet your definition of success.
- Apply the formula. Divide successes by attempts, then multiply by 100 to get a percentage. (successes÷attempts)×100=successrate
- Interpret the result in context. A 60 per cent success rate might be good in a tricky flow and poor in a simple one. Look for patterns and compare with past efforts or industry norms.
Example calculation
What does success rate mean?
Success rate doesn’t require complex maths. It is simply the number of times a defined goal was reached divided by the number of attempts, then multiplied by 100 so you can speak in percentages. In practice it looks like this:
(successful outcomes ÷ total attempts) × 100 = success rate
If a sales rep makes 50 calls and closes 20 deals, (20 ÷ 50) × 100 yields a 40 per cent success rate. If a support bot resolves 70 of 100 tickets, its success rate is 70 per cent. No matter the label, it’s always the ratio of wins to attempts. Nielsen Norman Group summarises it as a usability metric that shows whether users can perform a task at all.
Why success rate matters
For early‑stage founders and product managers, success rate turns fuzzy goals into concrete targets. By declaring, for example, “We want 80 per cent of users to finish onboarding,” you gain a yardstick for progress. Because it’s just a percentage, engineers, marketers and designers can all understand and talk about it. A rising rate signals improvements, while a flat line tells you to look closer. Since the same ratio applies to experiments, campaigns, support interactions and internal projects, it becomes a common language across the team. Khoros notes that success rate reveals where customers struggle and complements satisfaction scores.
Working out success rate
The calculation begins with a clear definition of success. Are you counting only perfect completions? Do partial completions count? Once you decide, count the number of successes and divide by the number of attempts. Here are some scenarios to illustrate the concept.
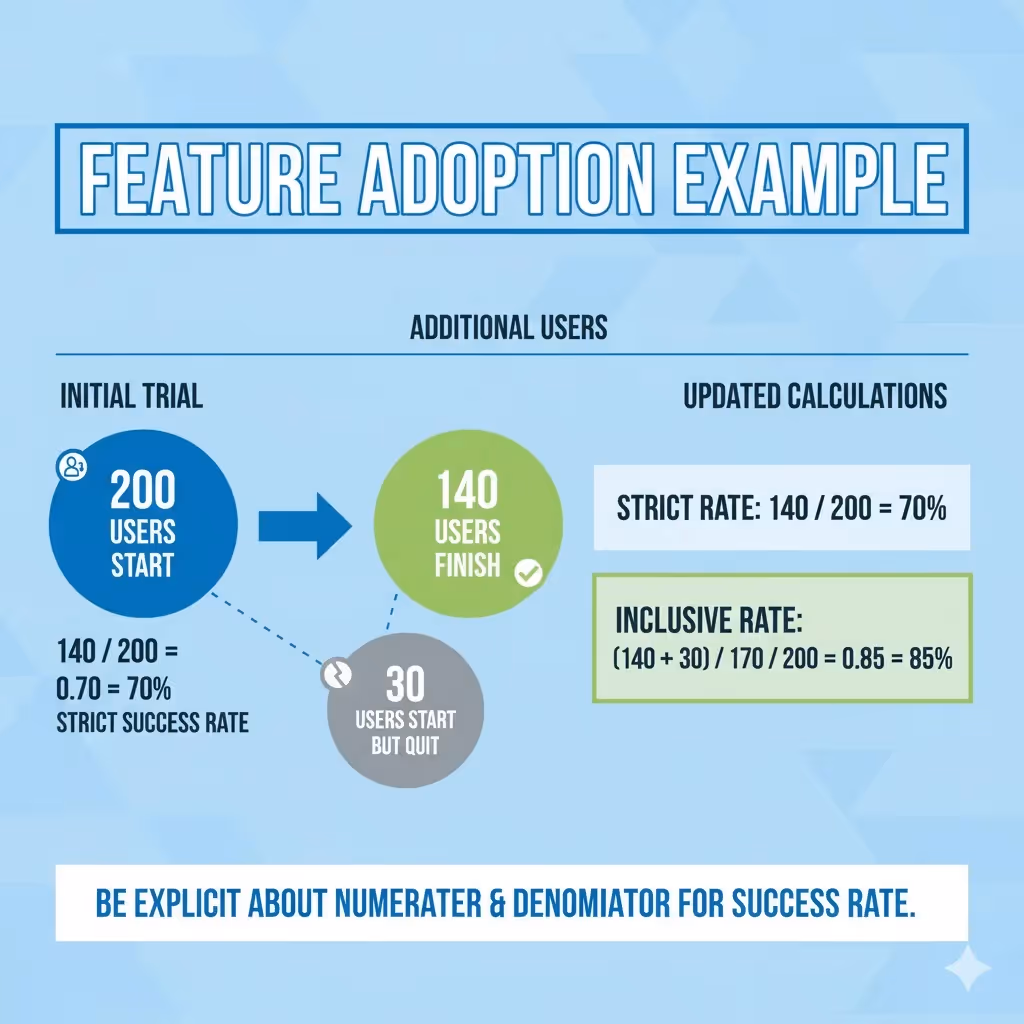
Feature adoption example
Suppose 200 users try a recommendation widget and 140 finish; the rate is 70 per cent. If another 30 start but quit, the strict rate stays 70 per cent, while including them pushes it to 85 per cent. Being explicit about the numerator and denominator is the first step when thinking about how to calculate success rate.
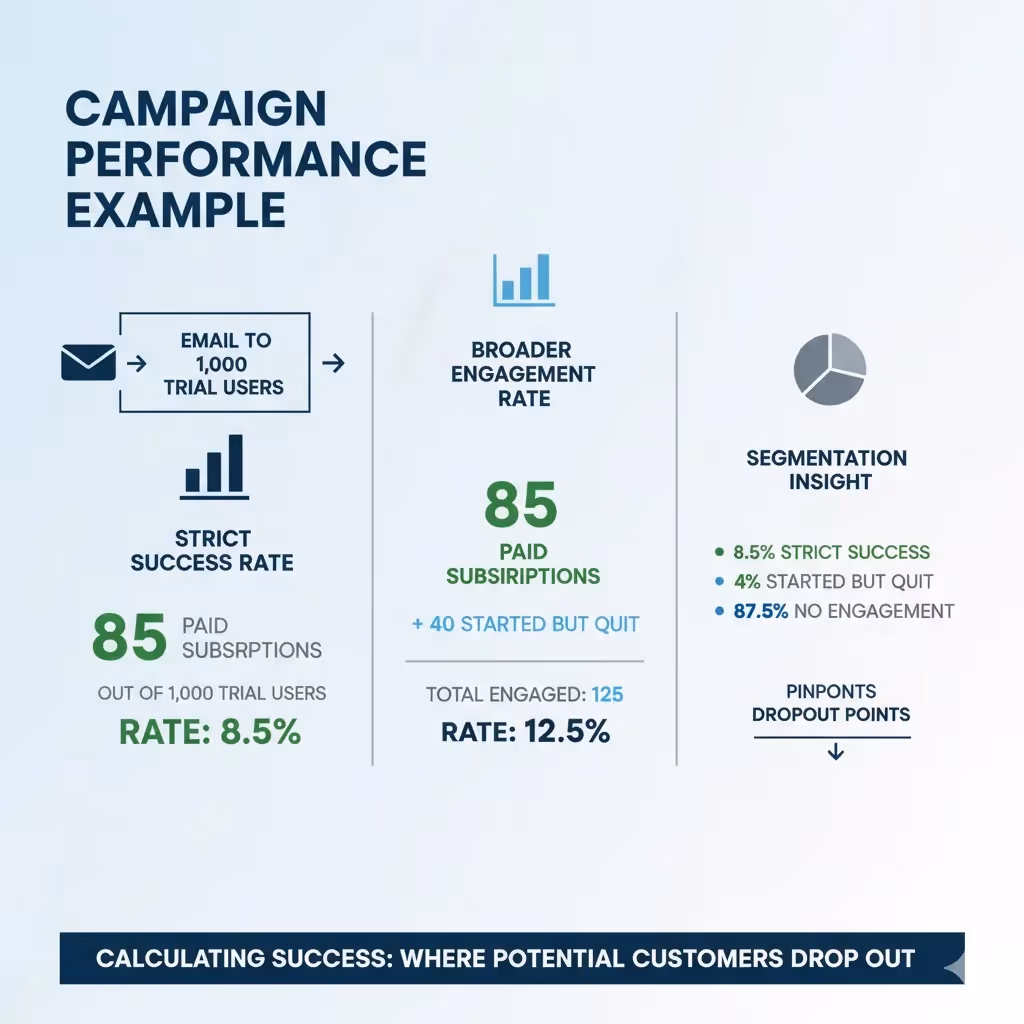
Campaign performance example
Or imagine an email to 1 000 trial users yields 85 paid subscriptions; the rate is 8.5 per cent. If 40 more start but quit, report both the strict 8.5 per cent and a broader 12.5 per cent. This segmentation shows how to calculate success rate in a way that pinpoints where potential customers drop out.
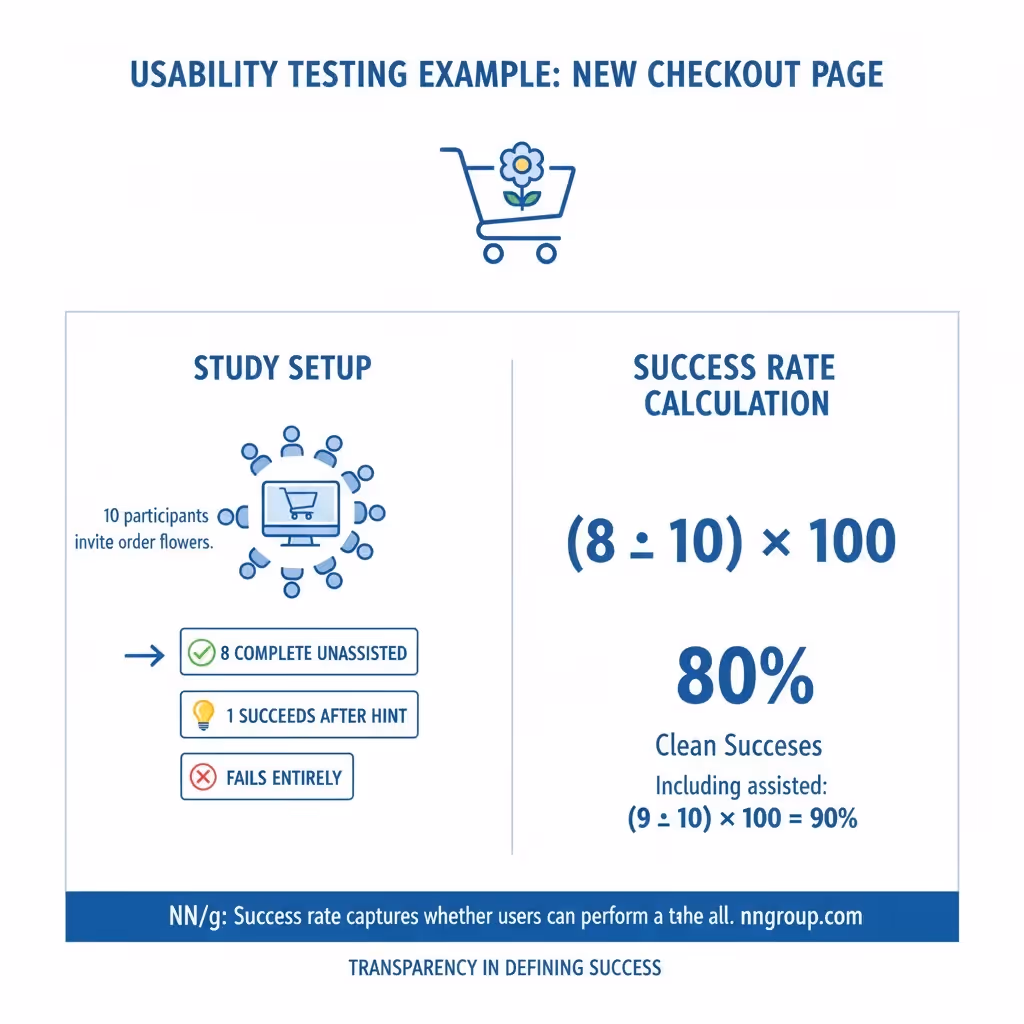
Usability testing example
When running a usability study on a new checkout page, you invite ten participants to order flowers. Eight complete the order unassisted, one succeeds after a hint, and one fails entirely. Counting only clean successes gives (8 ÷ 10) × 100, or 80 per cent. Including the assisted participant pushes it to 90 per cent. NN/g emphasises that success rate captures whether users can perform a task at all. This example shows how to be transparent about what counts as success.
Excel formula
In a spreadsheet, put attempts and successes in columns and use =(C2 ÷ B2) * 100 to work out the rate. Wrap it with IFERROR to avoid division by zero and use COUNTIFS for segments.
Contexts where success rate matters

1) User experience and usability testing
In user research, task success rate tells you if people can actually use your design. Instead of just tracking completion rate, which ignores errors, you record whether participants finish tasks without help, with help or not at all. This gives a more realistic picture of how the interface performs. Suppose five out of six participants order flowers successfully, but two use work‑arounds you didn’t expect. That still counts as success because the goal was met. By looking at success rate along with error types and time on task, you learn where to focus improvements. NN/g calls it a basic usability measure, and the earlier example shows how to calculate success rate for these tests.
2) Community and customer success
Khoros describes community success rate as the proportion of customers who achieve their goals. In a self‑service portal, this might mean a visitor finds an answer without opening a support ticket. If 1 400 out of 2 000 visitors mark their issue as solved, the rate is 70 per cent. Khoros warns that satisfaction scores alone can mislead. For community managers wondering how to calculate success rate, the important step is to define success (such as finding a solution) and measure it against total sessions.
3) Projects and internal experiments
The success rate isn’t only for customer‑facing work. At Parallel, we track internal experiments such as model fine‑tuning or process changes. If eight experiments run and five meet the goal, the success rate is (5 ÷ 8) × 100, or 62.5 per cent. More important than the number is what you learn from the misses. We label each failed experiment — perhaps due to data quality or unrealistic assumptions — and adjust our next iteration. Understanding how to calculate success rate here helps teams make confident decisions and allocate resources wisely.
For new ventures, success rate also serves as a simple risk gauge. Estimating the chance of a proposed feature hitting its goal forces you to articulate your assumptions. Even when those guesses turn out to be wrong, the discipline of writing down the expected rate encourages healthy debate and helps you learn faster.
Success rate and other metrics
Success rate can look similar to conversion and completion rates but it answers a different question. Conversion rate measures the proportion of users who take an intended action out of everyone who sees an offer. Completion rate counts how many finish a process, regardless of errors. Success rate focuses on whether the goal was achieved and allows for multiple paths. A sign‑up flow may have a high completion rate, yet if many completions require manual intervention the strict success rate will be lower. Understanding this ratio helps you choose the right metric for your question.
Complex paths and partial successes
Many flows have several steps and optional branches. A loan application might ask for personal details, identity verification, document uploads and term review. A clean success is finishing all steps without issues. If an applicant finishes only after repeated upload errors and a call to support, call this a partial success. Break the path into stages and track where people struggle. If the document upload step has a low rate, fix that part rather than overhauling the entire application.
Practical distinction from conversion rate
Conversion is the share of people who take an intended action from those who saw an invitation. Success rate concerns finishing a defined task like onboarding or solving a problem. If 5 000 people view a pricing page and 200 buy a plan, the conversion rate is four per cent. If half require help from support, the clean success rate is two per cent. Distinguishing these metrics shows where to improve: raising the offer's appeal or removing friction in the process.
Improving success rate
Raising your success rate isn’t about blindly pushing the numbers up; it’s about understanding what holds people back. Look at unsuccessful attempts and group them by cause — unclear tasks, system errors or missing information. Classify outcomes into clean success, success with errors, success with help and incomplete to see patterns. Many failures arise from confusing interfaces or needless complexity; simplifying steps or sensible defaults can lift the rate quickly. In one project, redesigning a dense settings page with clear defaults moved the rate from 50 to 85 per cent. Share these insights with colleagues — when numbers are paired with recordings and stories, they inspire action.
Common mistakes
There are several pitfalls to watch for when working with success rate:
- Ignore context – View a partial success like a clean one and you’ll miss design issues. Be clear about strict versus broad measures.
- Rely solely on numbers – A high rate doesn’t always mean a great experience. Pair it with qualitative feedback.
- Assume the past guarantees the future – A 70 per cent rate on past experiments doesn’t ensure the next one will succeed. Use the ratio to guide, not to predict.
Working out success rate with tools
For many teams, spreadsheets like Excel or Google Sheets are enough. Put attempts and successes in two columns and use a formula similar to =(successes ÷ attempts) * 100. The Bricks guide covers this formula and shows that using IFERROR avoids division errors. You can also compute rates for specific segments using functions like COUNTIFS. Knowing how to work out this ratio in a sheet means you can monitor progress without expensive tools.
As your product scales, analytics platforms such as Mixpanel or Amplitude help automate tracking. Define events that represent an attempt and a successful outcome, then build a metric by dividing one by the other. Many tools support segmentation by cohort, channel or timeframe. Community platforms like Khoros have built‑in success rate dashboards for customer support. Regardless of the tool, the principles remain the same: define success carefully, count attempts accurately and compute the ratio.
Conclusion
Success rate is clear and actionable; it tells you how often you achieve goals relative to attempts. It shines because it’s simple yet versatile — you can apply it to design experiments, feature adoption, community support and internal projects. A well‑defined rate brings teams together and uncovers friction. To make the most of it, define success deliberately, track partial and complete outcomes and pair the numbers with stories. Knowing how to calculate success rate empowers you to make better decisions, refine your product and build experiences that help users accomplish their goals.
Before you design your next experiment or feature, ask yourself what success would look like and how you’ll count it. Doing this early creates a shared understanding and prevents wasted effort. Too often teams launch projects without a clear definition of success and later debate whether they succeeded. Setting the measure upfront brings clarity and a shared direction. Take time to get on the same page with your team about what success means. Without a shared target, you might chase numbers that don’t matter. Success rate isn’t the only lens, but it’s one of the most grounding.
Thinking through success rates also encourages humility. Recognising that not every attempt will succeed helps teams stay open to learning and adapt as they grow. When outcomes are viewed as feedback instead of failures, the measure becomes a catalyst for continuous improvement.
Frequently asked questions
1) How do you work out the task success rate?
Define the task clearly, count how many participants complete it and divide by the total number of participants. Multiply by 100 to express it as a percentage. In a usability test, if eight out of ten participants finish a sign‑up flow without assistance, the task success rate is 80 per cent. If you include assisted completions, state that openly when explaining how to calculate success rate.
2) What is an example of a success rate?
If you send 100 in‑app prompts encouraging users to enable a new feature and 30 people enable it, divide 30 by 100 to get 30 per cent. Or, in sales, closing 20 deals from 50 calls gives a 40 per cent success rate. Such examples show how to calculate success rate in everyday contexts.
3) How do you measure success in general?
Start by defining what success looks like. Is it completing onboarding, solving a problem without support or hitting a performance target? Once defined, count how often it happens and divide by the number of attempts to get a percentage. It can be helpful to track strict success, partial success and completion separately. Pair quantitative measures with qualitative insights to get a full picture of why people succeed or struggle.
4) How do you work out the success rate in Excel?
Organise your data with one column for attempts and one for successes. In a formula cell, enter =(successes ÷ attempts) * 100. The Bricks guide suggests using = (C2 ÷ B2) * 100 when successes are in column C and attempts in column B. Wrap it with IFERROR to handle cases where there are no attempts. Segmented rates can be derived with COUNTIFS. This process illustrates the method using familiar tools.
5) What if there are zero attempts?
If no attempts were made, the formula breaks — you’d be dividing by zero. In this case, it’s best to report that the rate isn’t available yet, and show “N/A” or “–” instead of a number. Use IFERROR in Excel to catch this and avoid showing misleading results.
6) How do I handle partial successes?
Decide upfront what counts. If someone completes a task only after workarounds or support, you might classify it as a partial success. Track these separately from clean completions to spot friction points and see where users get stuck.
7) Is the success rate the same as the conversion rate?
No. Conversion rate measures how many people take a desired action out of those who were exposed to it (like seeing an ad or a pricing page). Success rate looks at how many finish a defined task after starting it — regardless of how they got there. You might have a high conversion rate but a lower success rate if many users struggle once they begin.

check out these related blogs


.webp)