As founders and product leaders, total addressable market (TAM) is a term we encounter repeatedly. It represents the total revenue opportunity available if you were the sole provider in your chosen market segment.
In my experience guiding early‑stage technology teams, the question isn’t whether TAM matters—it’s how to calculate TAM accurately and usefully. Investors, engineers and designers alike need a grounded view of the market’s potential, not an optimistic soundbite.
Throughout this article I’ll share practical frameworks, examples and cautionary tales from client work that help teams use TAM wisely. We’ll explore estimation methods, segmentation, competitive assessment, revenue potential, growth forecasting and actionable calculation approaches. Keep reading to learn how to calculate TAM responsibly.
Quick Answer: How to Calculate TAM
To calculate TAM (Total Addressable Market), start by choosing a method—top‑down, bottom‑up, or value‑based. Then apply the formula:
TAM = Average Revenue per User (ARPU) × Total Potential Customers.
Use reliable data sources, apply relevant segmentation filters, and document all assumptions to keep your estimate grounded and defensible.
What is TAM (Total Addressable Market)?
TAM measures the theoretical maximum revenue your product or service could earn if you captured 100% of the total demand in a defined market. Unlike actual sales forecasts, TAM is a sizing exercise—it does not assume monopoly control is feasible. Two related terms refine the concept:
- Serviceable Available Market (SAM) represents the portion of the TAM that a business can realistically target based on quality, price, geography or other constraints. It asks “what portion of the pie can we serve?”.
- Serviceable Obtainable Market (SOM) identifies the share of the SAM that the company can actually capture given its competitive environment and resources. It asks “how much can we realistically win in the near term?”.
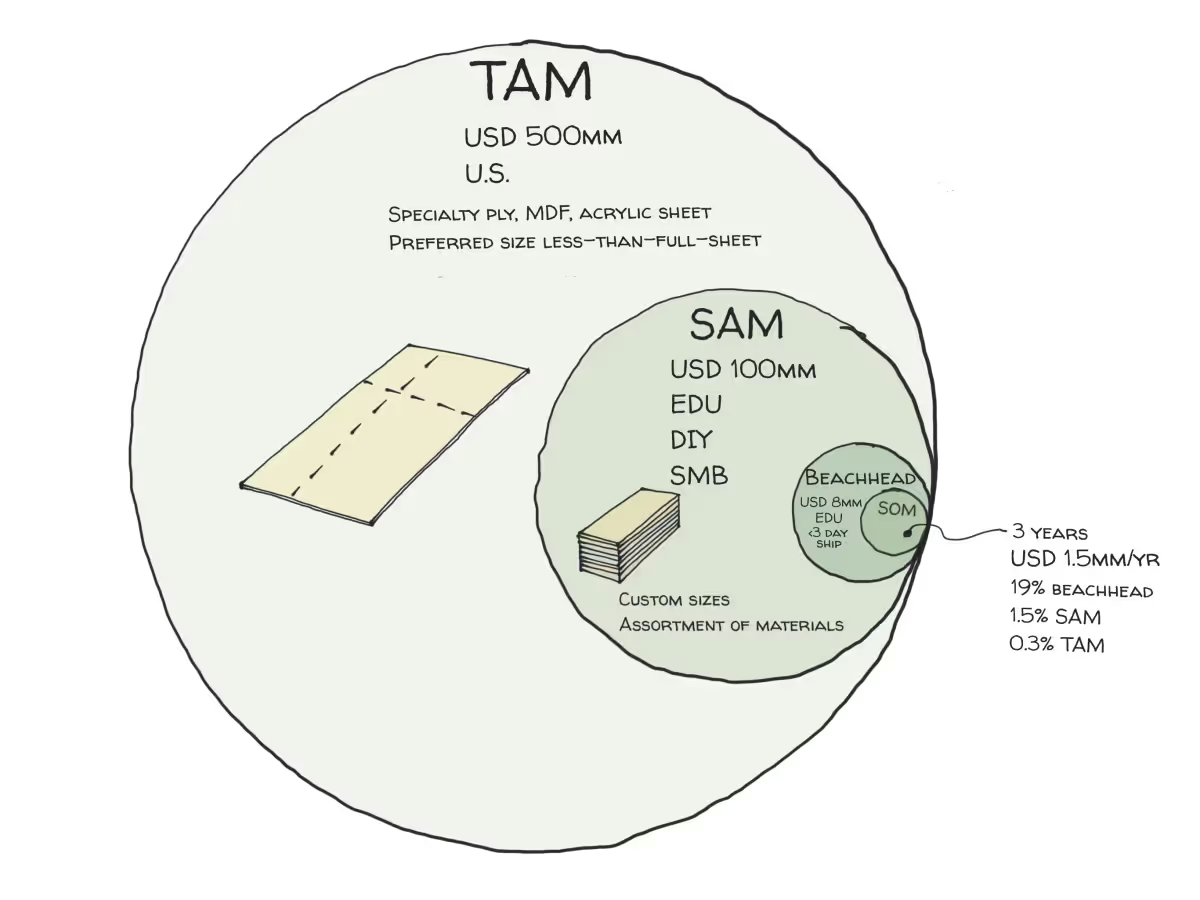
Understanding these distinctions prevents over‑ambition. For example, the workspace company WeWork faced a $1.35 trillion TAM but a SAM of $168 billion and an attainable SOM of $33.8 billion. The gap highlights why top‑down TAM estimates in pitch decks can be misleading if not accompanied by realistic SAM and SOM projections.
Avoiding hype
Y Combinator and Eric Ries often caution founders against using inflated TAM numbers to dazzle investors. A 2014 debate between venture capitalist Bill Gurley and finance professor Aswath Damodaran about Uber’s valuation illustrates the danger: Damodaran assumed Uber’s TAM was limited to the taxi market, while Gurley argued the company addressed a broader transportation market.

The lesson is not to throw out TAM, but to build bottom‑up assumptions and segment the market carefully. Focusing on realistic subsets fosters credibility and better product decisions.
Why startup leaders should care
As a fractional product strategist, I’ve seen teams neglect TAM with painful consequences. According to CB Insights’ analysis of 101 startup post‑mortems, building solutions for problems that don’t exist—failing to address a market need—was the number‑one reason for failure, cited by 42% of cases. Conducting a TAM exercise early helps ensure there is a real market problem worth solving. Other reasons to pay attention:
- Investor assessment: Investors want evidence that a business addresses a large and growing opportunity. A well‑researched TAM demonstrates the potential scale and helps justify funding. Burkland, a firm providing CFO services to startups, notes that venture capitalists generally seek opportunities capable of 10× returns; a clear TAM signals that a startup could deliver that magnitude.
- Strategic prioritisation: Knowing your TAM, SAM and SOM helps founders and product managers choose which segments to prioritise and how to allocate resources. HG Insights explains that TAM analysis enables go‑to‑market leaders to identify the most promising target segments and improve sales and marketing effectiveness.
- Product roadmap alignment: Customer feedback and competitive forces are key influences on product strategy. ProductPlan’s 2024 State of Product Management report found that 27% of product teams rely on customer feedback and 21% rely on competition/market analysis to shape strategy. These insights underscore that understanding market size and dynamics is integral to prioritising features and roadmaps.
- Risk mitigation: Over‑estimating the market leads to over‑staffing and burned capital. Under‑estimating can result in missed opportunities. An honest TAM analysis builds flexibility into forecasts and allows teams to adapt as more data becomes available. Burkland warns about pitfalls such as outdated data, single‑source dependence and uniform demand assumptions when estimating TAM.
In short, ignoring TAM can mean building the wrong product, raising too little or too much capital, or targeting the wrong segment. Taking the time to learn how to calculate TAM is an investment in the viability of your venture.
-
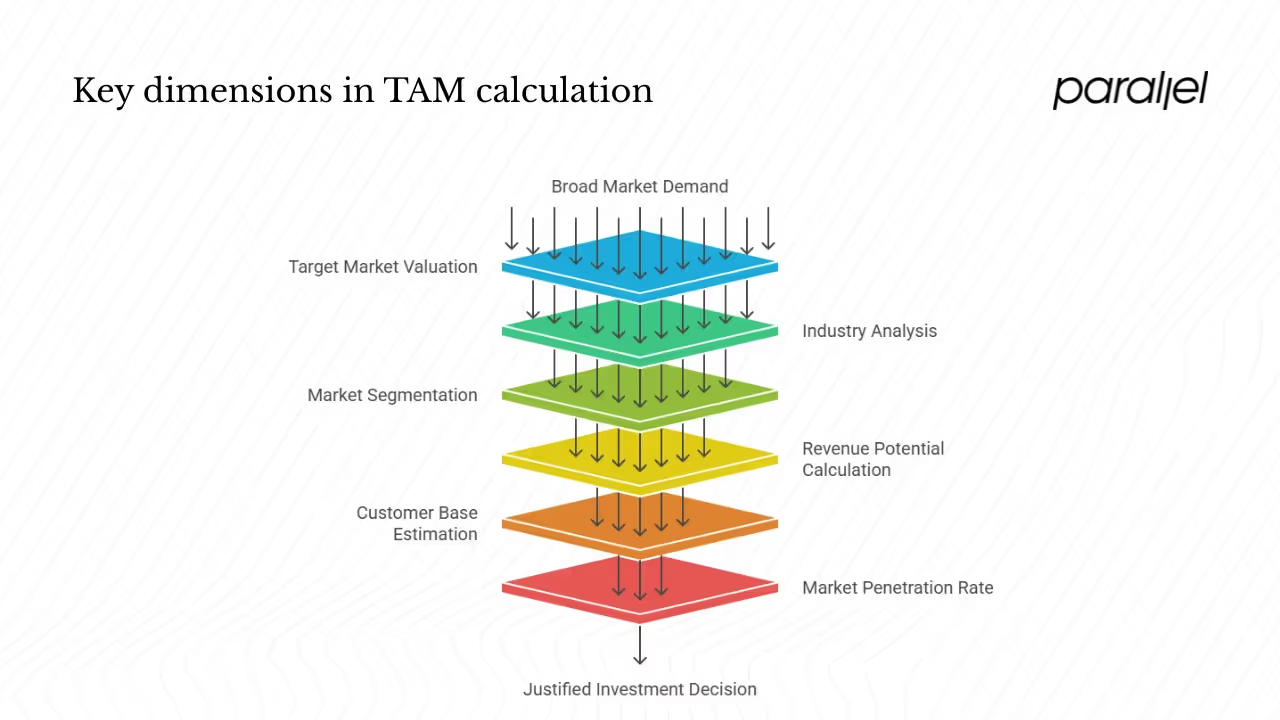
Key dimensions in TAM calculation
TAM analysis is more than a single number; it’s a structured examination of multiple factors. Here are the dimensions I use when guiding early‑stage teams.
1) Market size estimation
Start with a credible estimate of the total demand for your category. Industry reports, analyst data (e.g., Gartner, Forrester) and government statistics are good starting points. ProductPlan notes that external data rarely aligns perfectly with a company’s unique segmentation, so additional effort is required to tailor the figures. Burkland recommends using reports from Statista, IBISWorld, Forrester and Gartner to identify macro numbers before narrowing them.
2) Target market valuation
Once you have a broad figure, refine it to account for your specific product–market fit. Assess the characteristics of your ideal customer profile—firmographics, behaviors, technographics—and evaluate their willingness to pay. HG Insights emphasises defining an ideal customer profile (ICP) and gathering data on potential customers to calculate a more precise TAM. Differentiating between customers who could use your product and those who would realistically pay for it is crucial.
3) Industry analysis methods
Use a mix of top‑down, bottom‑up and value‑theory approaches. Toptal summarises these methods succinctly: a top‑down approach relies on macroeconomic data and narrows it down using filters; bottom‑up analysis extrapolates from real customer data and is perceived as more accurate; value theory estimates revenue based on the value the product provides. We will explore these methods in detail later.
4) Market segmentation
Segmenting your market by geography, demographics, firmographics, job‑to‑be‑done or industry vertical helps derive TAM, SAM and SOM. HG Insights recommends dividing your TAM into smaller segments to enable focused targeting. Without segmentation, you risk unrealistic assumptions about uniform demand.
5) Revenue potential calculation
The simplest formula for TAM is average revenue per user (ARPU) × total potential customers. HG Insights offers a similar formulation: multiply the number of potential customers by the average contract value. Your ARPU or contract value can be adjusted during business planning; the larger challenge is estimating the number of potential customers accurately.
6) Customer base estimation
Bottom‑up estimates start with actual or expected customers and scale up. For example, CFI’s hypothetical accounting software startup begins with 30 million potential businesses after filtering from a billion global businesses. Top‑down estimates begin with a broad population and apply percentages to narrow down, such as using the percentage of businesses lacking premium software. Each approach requires transparent assumptions and data sources.
7) Market penetration rate
Understanding your attainable market share is vital. Toptal explains that SOM shows how much of the SAM can be realistically captured based on competitive forces and company resources. Frameworks like Porter’s Five Forces can help assess competitive intensity and estimate a realistic market penetration rate.
8) Competitive landscape assessment
Estimating TAM without analysing competitors leads to inflated numbers. HG Insights notes that TAM analysis helps GTM leaders improve sales and marketing effectiveness by tailoring strategies to the competitive landscape. In practice, I encourage teams to list direct competitors, substitute products and adjacent solutions. Understanding who is already satisfying demand informs the SAM and SOM figures and reveals differentiation opportunities.
9) Growth rate forecasting
TAM is static if you ignore growth. Incorporate expected adoption curves and market growth rates into your projections. For example, if the addressable segment is growing at 12% annually due to digital transformation, your TAM could expand significantly over five years. While this article focuses on calculation methods, every estimate should be accompanied by low, base and high growth scenarios to accommodate uncertainty.
10) Business opportunity analysis
After calculating TAM, determine whether it justifies investment. CFI emphasises that evaluating a business opportunity involves estimating market size, investment needed, competitive landscape and expected growth rate. TAM is not a go/no‑go metric; rather, it feeds into decisions about go‑to‑market strategy, funding requirements, product scope and pricing.
Approaches to calculate TAM
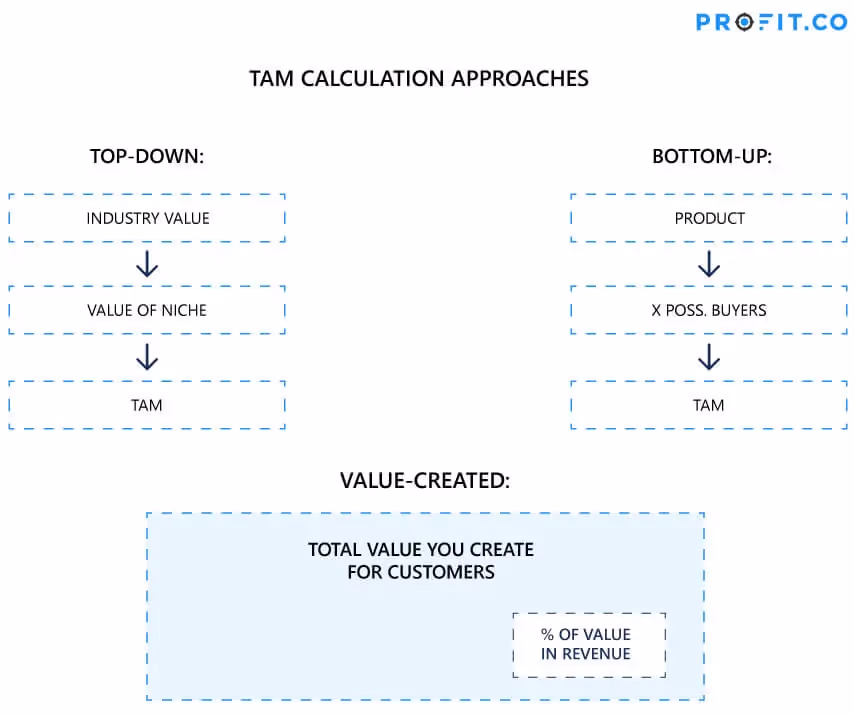
Approach #1: Top‑down approach
The top‑down method starts with a large population and progressively filters it. CFI describes it as an inverted pyramid: begin with a known population, apply demographic or usage filters, and then multiply by your price point. Burkland recommends using industry reports (Statista, IBISWorld, Forrester, Gartner) to determine the total market size and then apply a relevant segment percentage. For example, suppose you’re building a health‑tracking app. Reports show there are 300 million smartphone users in your region. If 40% are health‑conscious and you plan to target 10% of them initially, your TAM would be 300 million × 0.40 × your expected annual ARPU. The top‑down approach is quick and useful in early ideation but can over‑generalise and rely on assumptions from third‑party definitions.
Pros: Fast, leverages external data, good for preliminary sizing.
Cons: Highly dependent on assumptions; may not reflect unique customer behaviours; can exclude disruptive innovations.
Approach #2: Bottom‑up approach
The bottom‑up method begins with concrete data—pilot customers, pricing and adoption rates—and extrapolates. ProductPlan notes that bottom‑up estimates use a small sample or early adopter data and scale it to the wider market. CFI highlights that bottom‑up is more reliable because it relies on primary research. Burkland suggests calculating your Average Revenue per Customer (ARPC) from your existing sales, estimating the total number of potential customers and multiplying the two. For example, if your SaaS product generates $500 per customer annually and your research identifies 100,000 similar potential customers, your TAM is $50 million. Use surveys, pilot programs and CRM data to refine the numbers.
Pros: More accurate; builds on actual customer behaviour; easier to defend in investor discussions.
Cons: Requires access to reliable data; may underestimate potential if early users are not representative; scaling across geographies can be complex.
Approach #3: Value‑theory (value‑based) approach
When launching a novel product with no obvious comparables, the value‑theory approach estimates what customers would be willing to pay based on the value delivered. CFI explains that it requires assessing the value provided, determining how much can be captured through pricing, and multiplying by the number of customers. Burkland suggests using surveys, A/B tests and industry consultations to determine customer willingness to pay. For example, if a surgical AI tool saves hospitals $20,000 per year and there are 10,000 eligible hospitals, the value‑based TAM is $200 million. This method is particularly useful for disruptive solutions where historical spending data does not exist.
Pros: Accounts for new categories; emphasises customer value; helps price innovative products.
Cons: Subjective; requires careful research on willingness to pay; sensitive to optimism biases.
Cross‑validating TAM estimates
Never rely on a single method. Cross‑validation helps expose unrealistic assumptions. If your top‑down calculation yields a TAM of $1 billion but the bottom‑up figure is $50 million, revisit your segmentation and conversion assumptions. Toptal notes that pitch decks often omit SAM and SOM and make sweeping generalisations. Combining top‑down and bottom‑up estimates allows you to sanity‑check your numbers and adjust your go‑to‑market strategy. Additionally, compare your SOM against competitors’ market share; if it implies capturing 80% of the market in three years, you likely need to revise either your adoption rate or price point.
Common pitfalls & best practices
Based on client engagements and industry research, I’ve compiled a list of pitfalls to avoid and practices to adopt when learning how to calculate TAM:
Pitfalls to avoid
- Over‑optimism: Pitch‑deck theater often inflates TAM numbers to impress investors. Resist the temptation. As the CB Insights report illustrates, 42% of startups fail because they tackle problems without a true market need.
- Static assumptions: Markets evolve. Regularly update your TAM with new data, technology trends and regulatory changes.
- Single‑source bias: Relying on one report or dataset can skew your estimate. Burkland advises triangulating multiple sources and avoiding outdated information.
- Ignoring segmentation: Treating all customers as equal leads to unrealistic TAM numbers. Proper segmentation improves accuracy.
- Uniform demand assumptions: Demand varies across regions and demographics. Adjust your assumptions accordingly.
Best practices
- Triangulate methods: Use top‑down, bottom‑up and value‑theory methods to cross‑check results.
- Document assumptions: List the data sources, filters, conversion rates and price points you used. Transparency builds trust with investors and team members.
- Engage cross‑functional teams: Involve product, design, finance and marketing leaders in the exercise. Diverse perspectives reveal blind spots.
- Iterate frequently: Revisit your TAM as you gather real customer data and market feedback. Early pilots and user interviews provide valuable input.
- Balance ambition with realism: Aim for a TAM large enough to justify investment but grounded enough to guide achievable goals.
Step‑by‑step TAM calculation checklist (actionable)
To put theory into practice, here’s a checklist I follow when teaching teams how to calculate TAM:
- Define market scope: Clearly articulate the problem your product solves and the boundaries of your market.
- Identify segmentation dimensions: Choose relevant filters—industry, company size, geography, use case—that refine your TAM.
- Gather data: Collect macro figures from industry reports and government statistics; supplement with surveys, pilot data and CRM insights.
- Choose calculation method(s): Decide whether top‑down, bottom‑up, value‑theory or a mix is most appropriate.
- Compute TAM: Apply the chosen method(s) to derive your maximum revenue opportunity. Use the formula ARPU × total potential customers.
- Derive SAM and SOM: Narrow your TAM using your segmentation and competitive analysis to find the serviceable and obtainable markets.
- Validate assumptions: Cross‑check results using multiple methods and against competitor benchmarks.
- Document assumptions: Record data sources, filters, conversion rates and pricing used in calculations for transparency.
- Integrate into strategy: Use the insights to align product roadmaps, pricing strategies and investment pitches. Align design and engineering efforts accordingly.
- Update regularly: Revisit your TAM as markets evolve, new data emerges or your product scope expands.
Conclusion
Calculating TAM isn’t glamorous; it’s a disciplined exercise that underpins strategic clarity. For founders, product managers and design leaders, understanding how to calculate TAM guides everything from feature prioritisation to fundraising. A balanced, evidence‑based approach—combining top‑down estimates, bottom‑up realities and value‑based insights—helps teams avoid hype and build products people actually need.
The real power of TAM lies not in the size of the number but in the process of questioning assumptions, learning about customers and aligning cross‑functional teams. When done well, TAM analysis becomes a shared artefact that informs strategy and fosters mature decision‑making. As markets evolve and new data surfaces, revisit your TAM, SAM and SOM. Your business’s potential is dynamic; treat your market sizing the same way.
FAQ
Q1. How do you find TAM?
Begin by defining your market and segmentation. Then choose between top‑down and bottom‑up methods—or blend them—to estimate potential customers. The top‑down approach uses industry reports and macro data, narrowing by geography, demographics or use case. The bottom‑up approach starts with actual or projected customers and multiplies by your ARPU. When no comparable market exists, use the value‑theory method: estimate the value your product delivers and determine what customers would pay. Cross‑validate results and document assumptions.
Q2. What is the formula for total market size?
At its simplest, TAM = average revenue per user (ARPU) × total potential customers. In top‑down analysis, you calculate the number of potential customers by starting with a broad population and applying segmentation percentages. In bottom‑up analysis, you derive the customer count from actual data or pilot studies. In value‑theory analysis, you replace ARPU with the value captured per customer.
Q3. How to calculate TAM for fingers?
If you literally mean calculating a “TAM for fingers,” think of the physical market: the number of people × average number of fingers per person × average spend per finger‑related product (e.g., rings or gloves). For example, with 8 billion people and 10 fingers each, there are roughly 80 billion fingers. Multiply by the average annual expenditure on finger‑specific items to get your TAM. Of course, in most business contexts this question is metaphorical, reminding us to define the market narrowly and realistically.
Q4. What is TAM in market size?
TAM (Total Addressable Market) is the overall revenue opportunity available if your product or service captured 100% of the market for a given problem. It represents the entire potential customer base—“how big is the pie?”. TAM is a starting point for market sizing; realistic planning requires deriving the serviceable available market (SAM) and the serviceable obtainable market (SOM)

check out these related blogs


.avif)