Estimating the potential scale of an idea is one of the first hard questions founders must answer. Investors want to know whether the business can grow into a sizable outcome, product teams need to prioritize roadmaps, and marketing leaders must allocate resources wisely. A solid total addressable market (TAM) calculation isn’t just a deck filler — it’s how you validate the size of the prize and decide if an opportunity is worth pursuing.
This guide shows how to calculate TAM for startup founders and product managers, explains related concepts like serviceable available market (SAM) and serviceable obtainable market (SOM), and offers a step‑by‑step framework grounded in real‑world experience. By the end, you’ll understand when to use each metric, how to avoid common pitfalls, and how to translate market sizing into actionable strategy.
What Is TAM (Total Addressable Market)?
TAM represents the total revenue potential if your product or service were to dominate the entire market. In other words, it’s the maximum possible demand for your solution — the top of the funnel before any constraints. As HubSpot notes, total addressable market refers to the total market demand for a product or service and is useful for objectively estimating a market’s potential for growth. Some investors call this the “total available market,” but the idea is the same: a theoretical best‑case scenario where you have 100% share of all potential customers.

Why TAM matters: Founders and product leaders use TAM to signal potential scale, prioritize which segments to attack first and set context for SAM/SOM calculations. Sopro’s 2025 guide notes that these metrics “help you talk like an investor,” keep you grounded and shape your growth plan. A thoughtful TAM analysis shows that you understand both the size of the opportunity and the limits of your reach. Investors regularly sanity‑check your TAM assumptions to validate the upside; an inflated number without credible backing will raise red flags.
Relation to SAM and SOM: TAM sets the outer boundary. SAM narrows that universe to the customers you could realistically serve given your solution and go‑to‑market focus. SOM narrows further to the share you aim to capture in the near term. Thinking about TAM in isolation can mislead you into chasing overly broad markets; instead, treat it as part of a nested framework where each layer informs the next.
Common pitfalls: Overinflated TAM estimates are common because they impress at first glance. But if your TAM is unrealistic — such as claiming every smartphone user is a potential customer for a niche app — investors will question your grasp of the market. Another trap is using secondary numbers without defending assumptions; credible TAMs rely on data, not wishful thinking. Additionally, TAM should be defensible: a startup cannot realistically serve every segment; regulatory, cultural or technical barriers will shrink your real opportunity.
TAM vs SAM vs SOM: How They Fit Together
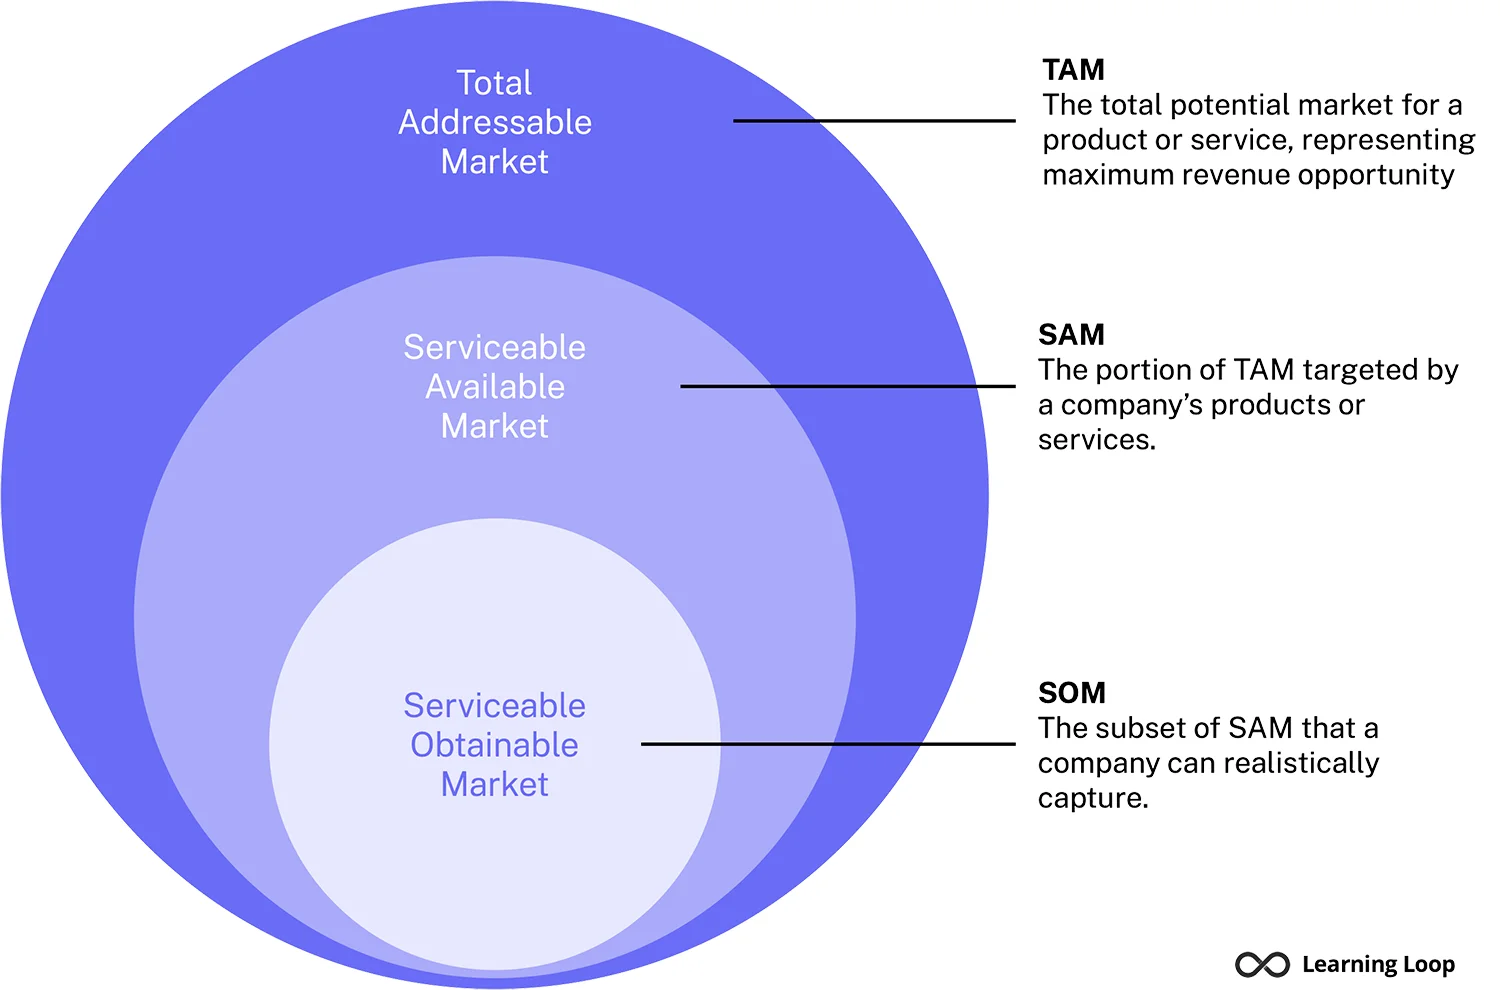
Understanding how to calculate TAM for startup success requires appreciating how TAM, SAM and SOM interplay. They’re often depicted as nested circles or a funnel:
- TAM is the outer circle — the full revenue potential if every possible customer adopted your solution. It’s used for vision and long‑term scale.
- SAM sits inside TAM — it is the portion you can serve based on your product’s capabilities, target audience and geographical reach. HubSpot defines SAM as the size of the TAM you can reasonably target. SAM helps you identify where to focus your resources.
- SOM is the innermost circle — the market share you realistically expect to win in the short term given competition and your own resources. It answers questions like: “What can we achieve in the next two years?” SOM is essential for near‑term revenue forecasts.
You shouldn’t present TAM without SAM and SOM. A large TAM is meaningless if your SAM is small or crowded, and your SOM may be a tiny fraction of the SAM if you’re resource‑constrained. Use TAM for long‑term vision and investor narratives, SAM for focusing product and marketing strategies, and SOM for operational targets. This layered approach not only clarifies expectations but also builds credibility.
Approaches to Calculating TAM
There is no single formula for TAM; different approaches suit different stages and data availability. Here are three commonly used frameworks.
Top‑down approach
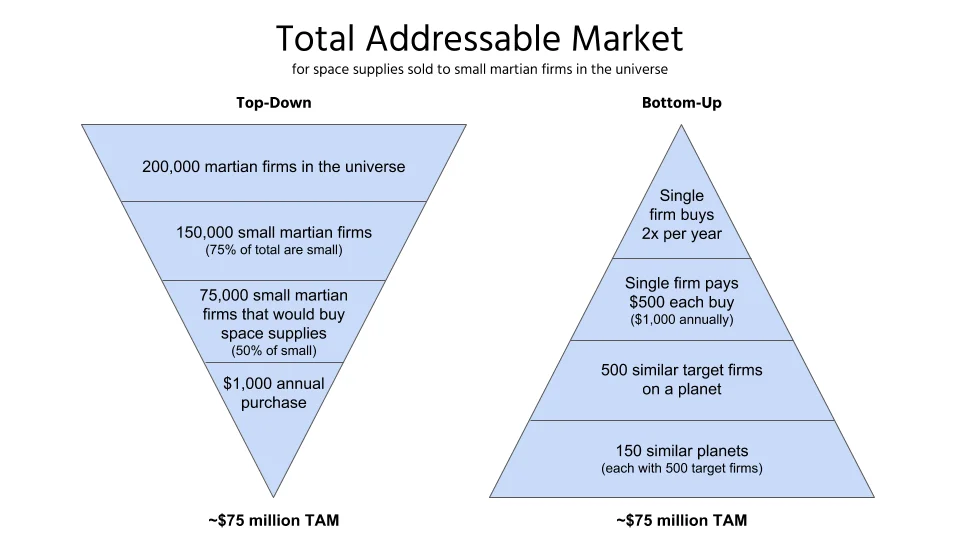
The top‑down method starts with macro data (industry revenue or broad market spend) and narrows it to your niche. Sopro recommends pulling data from industry reports, trade associations and competitor filings to size the entire industry. You then estimate your portion using assumptions about target segments, geographic focus or customer types. The basic formula is:
TAM = Total number of potential customers × Average revenue per customer.
Pros: It’s relatively quick and provides a high‑level ballpark, helpful in the early stages or when you lack internal data. Cons: Top‑down estimates rely heavily on broad assumptions; if the source data doesn’t reflect your niche, your TAM may be too coarse. Use this method when you need a directional view or to sense‑check bottom‑up calculations.
Bottom‑up approach
The bottom‑up method builds TAM from the ground up using your own unit economics and adoption assumptions. Kalungi’s framework describes starting with the full universe of potential customers, then narrowing to those who fit your ideal customer profile. Steps include:
- Define target segments. Identify industries, company sizes, geographies or demographics. For each segment, estimate the number of potential customers.
- Estimate revenue per customer. Use realistic pricing (e.g., annual contract value or average revenue per user) based on your offering.
- Multiply and sum across segments. Multiply customers in each segment by revenue per customer and sum to get TAM.
Pros: This method is grounded in actual business assumptions and can be easily adjusted as you learn more.
Cons: It requires assumptions that may be wrong, and errors compound as you scale up. Use bottom‑up when you have data from pilots or early traction and want a more realistic estimate.
Hybrid / triangulation approach
Many teams combine both methods to triangulate a credible range. Start with a top‑down estimate to understand the industry’s ceiling, then build a bottom‑up model to reflect your specific product and go‑to‑market. Compare the two; if they diverge widely, refine assumptions or adjust with safety margins. Bringing in third‑party benchmarks or competitor data can improve accuracy and make your TAM defensible to investors.
Adjustments and proxies
You may need to adjust TAM estimates when addressing emerging markets or adjacent geographies. For example, using proxy markets (similar industries or regions) can provide reference points when data is scarce. Consider market maturity, growth trends, adoption rates and regulatory or infrastructure constraints. Discount high‑level TAM numbers by realistic adoption ceilings; not all potential users will adopt your product.
Step‑by‑Step Guide to Calculate TAM for a Startup
In client projects we’ve often been asked how to calculate TAM for startup products while still in exploratory mode. Here’s a practical workflow to follow:
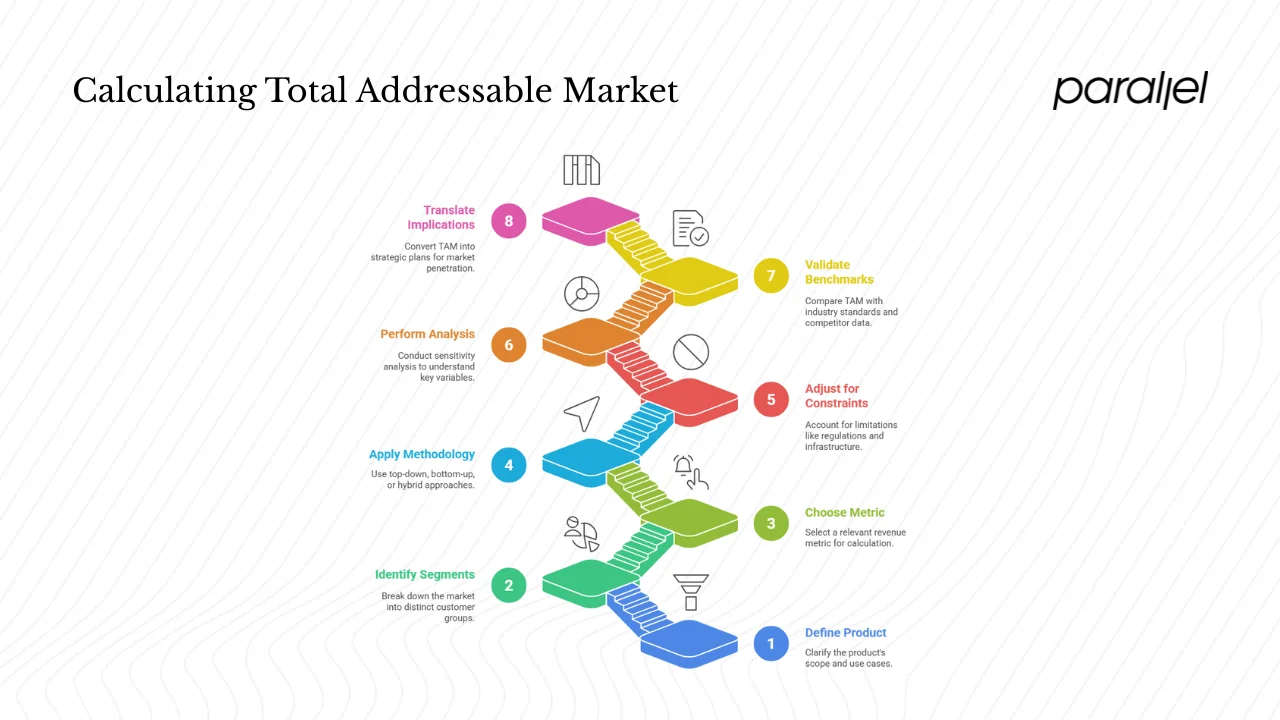
- Define your product and scope. Clarify the problem you solve, the core use cases and the geographic or vertical boundaries. A vague product definition leads to an inflated TAM. Be explicit about whether you’re counting only one product line or a broader platform.
- Identify market segments and customer personas. Break down the market by industry verticals, company sizes, regions or customer demographics. For each segment, estimate the number of potential customers and define their buying behavior. Use firmographic data and customer research to refine numbers. Reach3 Insights warns that companies that fail to understand their audiences risk misallocating marketing resources; segmentation ensures you’re sizing a market you can actually reach.
- Choose a revenue metric. Decide on the unit of revenue that aligns with your business model: annual recurring revenue (ARR), average revenue per user (ARPU), average selling price (ASP) or lifetime value. Normalize pricing over a relevant period (annual is common) and avoid aspirational pricing; use what early customers are actually paying.
- Apply a methodology. Use a top‑down, bottom‑up or hybrid approach to estimate your TAM. If using top‑down, pull credible industry data and apply filters for your niche. For bottom‑up, multiply addressable customers by realistic revenue per customer. In most cases, we recommend triangulating both methods to produce a low, base and high scenario.
- Adjust for constraints and filters. Remove customers you can’t realistically serve due to regulation, language, infrastructure or go‑to‑market constraints. Include adoption curves and penetration ceilings; not every eligible user will buy your product. HubSpot highlights that SAM is inherently smaller than TAM because specialization, geography and other limitations restrict who you can serve. Similarly, narrow to the SOM by factoring competition and resource limits.
- Perform sensitivity analysis. Create low, base and high cases by varying key assumptions (e.g., ARPU ±20%, addressable customers ±10×). Document every assumption so that investors can trace your reasoning. Stress‑testing your model surfaces which variables most influence TAM and where you need better data.
- Validate against benchmarks. Compare your TAM with published industry reports, competitor revenue and analyst estimates. Sopro suggests using third‑party benchmarks from sources like Gartner or trade associations. If your TAM is wildly larger than comparable companies’ markets, revisit assumptions.
- Translate into strategic implications. Convert TAM into SAM and SOM to plan your go‑to‑market. Estimate market penetration rates and map them to your product roadmap and fundraising narrative. Kalungi emphasizes that using TAM, SAM and SOM strategically helps you achieve faster traction by focusing on a segment you can dominate.
Layering in Market Segmentation & Demographics
Segmentation isn’t just a marketing exercise — it’s fundamental to how to calculate TAM for startup accuracy. Not all potential users are equally addressable. Reach3 Insights notes that consumer behaviors shifted dramatically post‑COVID and that companies failing to understand their audiences risk missing opportunities and misallocating resources. Incorporating segmentation into TAM ensures your numbers reflect the real market conditions.
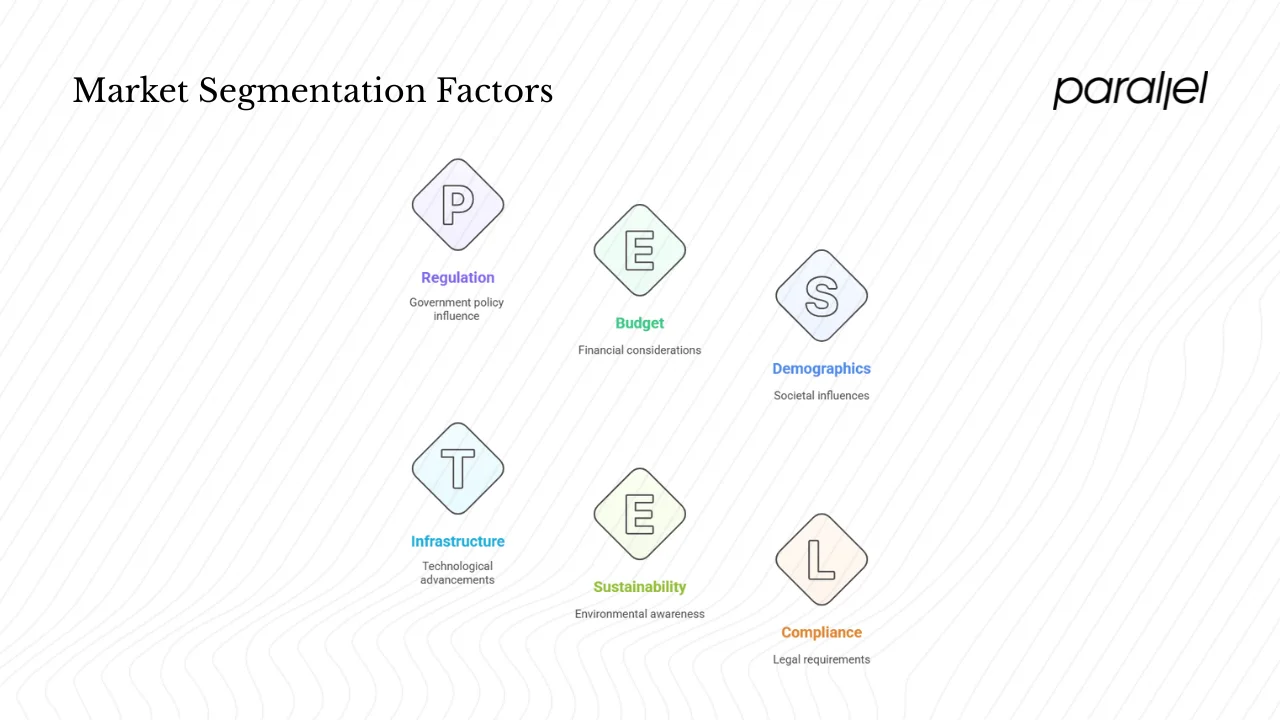
Types of segmentation:
- Geography: Consider the countries, regions or cities you can reach. Infrastructure, regulation and language can reduce your SAM.
- Industry vertical: Different verticals may have varying budgets and pain points. Kalungi’s example shows how a SaaS provider targeting nonprofits narrows from all nonprofits (TAM) to mid‑sized nonprofits (SAM).
- Firm size: Large enterprises and SMBs often have different requirements and price sensitivity. Segmenting by size helps tailor pricing and penetration assumptions.
- Customer persona/demographics: Demographics such as age, gender or role influence adoption and willingness to pay. For consumer products, align your segments with lifestyle and spending patterns.
Applying segmentation to TAM: After estimating TAM, overlay your segmentation criteria. For instance, if only 30% of the TAM matches your ideal customer profile (ICP), adjust your SAM downward accordingly. Use first‑party data, surveys or market research to estimate the proportion of each segment within the broader market. When data is scarce, proxy metrics (e.g., number of companies by employee count in a region) can help approximate segment sizes.
Competitive Landscape & Market Penetration Rate
TAM calculations often fail when competition and penetration rates are ignored. Even if your SAM is large, you won’t capture all of it. The Serviceable Obtainable Market (SOM) forces you to account for market share and internal capacity. Kalungi recommends identifying a beachhead segment where you can build credibility and optimize go‑to‑market motions before expanding.
Estimating realistic penetration: Look at benchmarks from similar companies to gauge typical adoption curves. For example, if you’re entering a crowded SaaS category where leaders hold 30–40% share, your near‑term SOM might realistically be 1–5% of the SAM. Align penetration rates with resource capacity; a small sales team will capture less market share than an enterprise sales force.
Avoiding optimism bias: Don’t assume a monopoly or that competition is static. Competitors can respond with price cuts or feature parity, shrinking your SOM. Use historical growth curves of analogous products to set expectations; if similar startups achieved 3% market share after five years, use that as a reference. Overestimating SOM is one of the most common mistakes we see — investors will discount projections if penetration assumptions aren’t grounded.
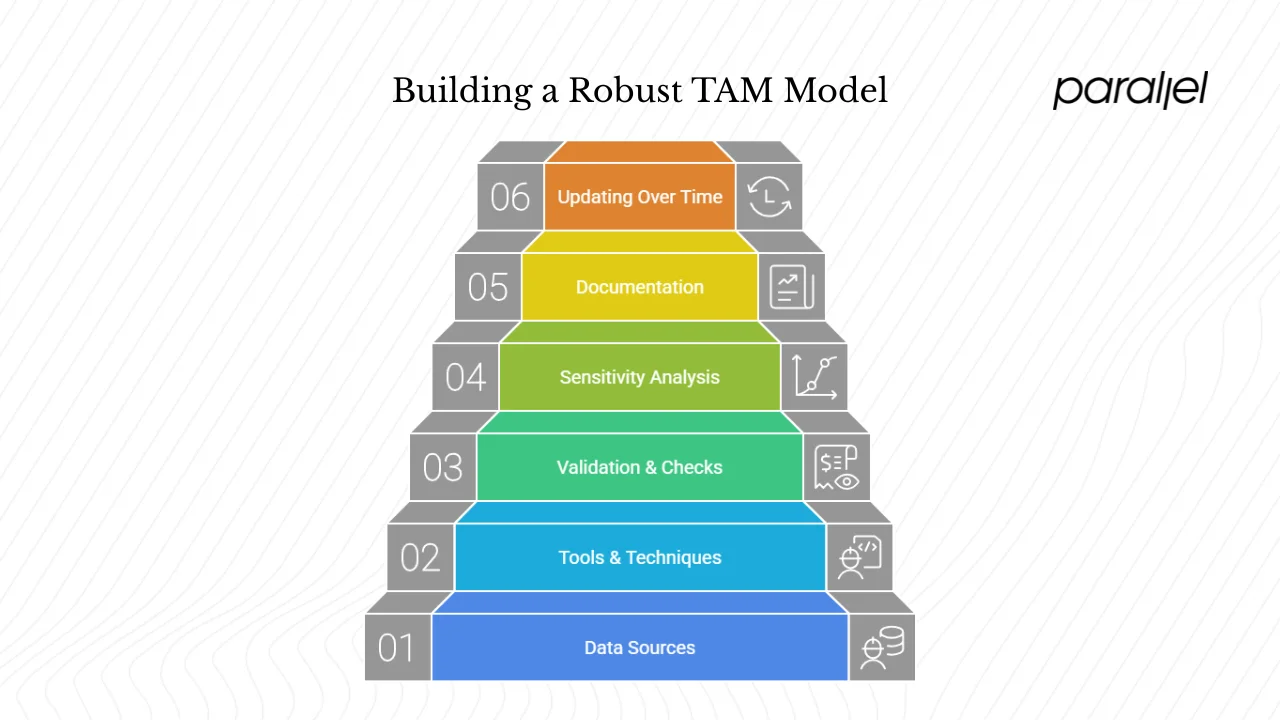
Practical Steps: From Data to Model
Building a robust TAM model requires both data collection and analytical rigor. Here’s a checklist of inputs and tips:
- Data sources: Industry reports (Statista, Gartner, IDC), government statistics (e.g., census data), trade associations, competitor filings and market research surveys. Sopro emphasizes using credible sources to pull total industry figures. For emerging tech, look for adjacent market proxies or analyst forecasts.
- Tools & techniques: Use spreadsheets to build the bottom‑up model; simple formulas often suffice. For more complex models, Python or R can help run simulations or sensitivity analysis. Surveys and interviews provide qualitative insight, while public company reports offer pricing and customer metrics.
- Validation & sanity checks: Compare your TAM with valuations or revenue of public comparators. If your TAM is $5 billion but incumbents only generate $200 million annually, your estimate may be inflated. Reach out to experts or mentors for feedback.
- Sensitivity analysis: Build low, base and high scenarios by varying key assumptions. Document each scenario’s drivers so stakeholders understand where the numbers come from. Use scenario ranges to reflect uncertainty, rather than a single point estimate.
- Documentation: Clearly state the data sources, assumptions and calculation steps. This transparency helps investors and team members critique and trust your model.
- Updating over time: Markets evolve. Revisit your TAM, SAM and SOM at least annually or whenever there’s a major product or market change. Post‑COVID shifts are a reminder that consumer behavior can change quickly. Maintaining an updated model ensures your strategy remains relevant.
Example Walkthrough: TAM for a Hypothetical Startup
Let’s apply these concepts to a hypothetical B2B SaaS that offers scheduling software for small medical clinics. We’ll walk through both top‑down and bottom‑up approaches to how to calculate TAM for startup modeling.
Step 1: Define the product and scope. The software automates appointment booking and integrates with electronic health records for clinics of 2–20 physicians in the United States. The value proposition is reducing no‑show rates and administrative workload.
Step 2: Identify segments. Our ICP is independent clinics (family medicine, dentistry, dermatology) with 2–20 providers. According to U.S. government data, there are roughly 30,000 such clinics nationwide.
Step 3: Choose a revenue metric. We charge $200 per provider per month, or $2,400 per provider annually. With an average of 5 providers per clinic, annual revenue per clinic equals $12,000.
Top‑down approach:
- Estimate the total spend on scheduling software for clinics by using market research: Suppose the total practice management software market in the U.S. is $5 billion. If scheduling software accounts for 10% of that, the segment is $500 million.
- Our TAM equals $500 million (assuming every clinic buys scheduling software from someone). This is the full pie.
- To derive SAM, we focus on clinics with 2–20 providers; if this segment represents 60% of all clinics, the serviceable market is $300 million.
- For SOM, we estimate capturing 2% of the SAM over the next 3–5 years (about $6 million in annual revenue). This accounts for competition and our limited sales capacity.
Bottom‑up approach:
- Total addressable clinics: 30,000.
- Annual revenue per clinic: $12,000.
- TAM = 30,000 × $12,000 = $360 million. (Note: This differs from the top‑down estimate; the difference prompts us to investigate further.)
- To refine SAM, remove clinics outside our geographic focus (e.g., exclude states with strict telehealth regulations) and clinics that already use integrated hospital systems. Suppose that leaves 20,000 clinics; SAM = 20,000 × $12,000 = $240 million.
- For SOM, we factor in resource constraints — our small sales team can sign 300 clinics in the first year (300 × $12,000 = $3.6 million). Over three years, with moderate growth, we might reach 1,000 clinics ($12 million), representing 5% of SAM.
Reconciling the two methods: The top‑down estimate produced $300–500 million, while the bottom‑up produced $240 million. Both are within the same order of magnitude, which increases confidence. If they differed radically, we would revisit assumptions (e.g., average revenue, number of clinics). Presenting both methods with sensitivity ranges demonstrates that your TAM isn’t a random guess.
Strategic implications: With a SOM of $3.6–12 million, this startup can build a credible story for a seed round while showing a path to double‑digit millions in revenue. The TAM shows long‑term potential if the company expands into adjacent verticals (e.g., larger clinics, hospital departments) or geographies.
How Investors Use TAM & Related Metrics
Investors use market sizing to gauge whether your startup can deliver venture‑scale returns. A clear TAM/SAM/SOM analysis tells them you understand your playing field and have a realistic plan. According to Sopro, these metrics help you “talk like an investor,” keeping you grounded and shaping your growth plan. Here’s what investors look for:
- Credible assumptions: Back up numbers with data sources and realistic adoption rates. If your TAM seems inflated or your SOM assumes unrealistic penetration, investors will discount your model.
- Focus: They want to see that you’re targeting a specific, winnable niche rather than chasing every possible customer. Kalungi stresses that focusing on a segment where you can dominate leads to faster traction and better credibility.
- Scalability: A large TAM signals room to grow beyond the initial niche. If your TAM is too small (e.g., under $100 million), investors may question whether the company can reach venture‑scale outcomes. However, a smaller TAM can be acceptable if your SOM shows strong profitability and the business can expand into adjacent markets.
- Roadmap alignment: Your TAM/SAM/SOM should tie to your product roadmap and fundraising narrative. For example, you might show that initial funds focus on capturing SOM, while later rounds enable expansion into other segments within the SAM.
When presenting TAM to investors, use simple visuals like nested circles or funnel charts. Highlight the assumptions, show low/medium/high scenarios, and relate the numbers to your go‑to‑market plan. Avoid false precision; round large numbers and focus on orders of magnitude rather than decimal points.
Common Mistakes & How to Avoid Them
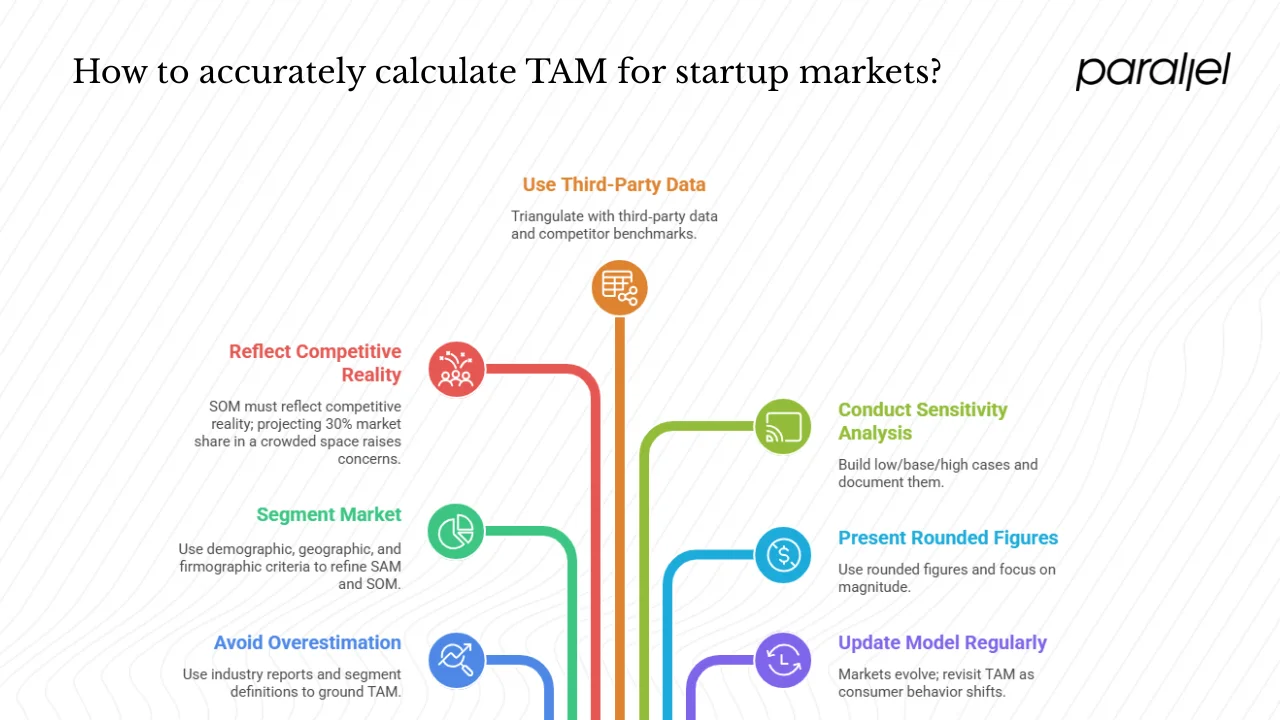
Through experience with early‑stage teams, we’ve seen recurring mistakes when founders attempt how to calculate TAM for startup markets:
- Overestimating TAM. Claiming the entire smartphone user base or global population misleads investors. Use industry reports and segment definitions to ground your TAM.
- Ignoring segmentation. One‑size‑fits‑all market leads to inflated numbers and poor product fit. Use demographic, geographic and firmographic criteria to refine SAM and SOM.
- Assuming monopoly penetration. SOM must reflect competitive reality; projecting 30% market share in a crowded space raises concerns.
- Basing TAM only on assumptions. Triangulate with third‑party data and competitor benchmarks.
- Skipping sensitivity analysis. Without scenario ranges, you can’t understand how changes in assumptions impact TAM. Build low/base/high cases and document them.
- Presenting false precision. Quoting TAM to the nearest $1 million suggests overconfidence. Use rounded figures and focus on magnitude.
- Failing to update your model. Markets evolve; revisit TAM as consumer behavior shifts.
Tips for Presenting TAM in Your Startup Context
When it’s time to share your market sizing with investors or your team, consider these techniques:
- Use intuitive visuals. Nested circles or funnel charts convey the relationship between TAM, SAM and SOM. Donut charts can illustrate segment breakdowns.
- Highlight key assumptions up front. List your core inputs (number of customers, ARPU, adoption rate) so audiences know what drives the numbers.
- Show multiple scenarios. Present optimistic, base and conservative cases to demonstrate that you’ve stress‑tested the model and are prepared for variability.
- Tie to your roadmap. Explain how your product roadmap aligns with moving from SOM to SAM and eventually capturing more of the TAM. For example, a future feature may open a new segment, expanding the SAM.
- Defend your numbers. Be ready to explain why your assumptions are reasonable, referencing data sources or similar companies. Avoid being defensive; treat the exercise as collaborative problem solving.
- Keep it narrative‑driven. Numbers alone don’t tell a story. Frame the TAM/SAM/SOM discussion around the customer problem, your solution and how capturing a segment translates to impact.
Conclusion
Understanding how to calculate TAM for startup opportunities isn’t about picking a big number — it’s about using market sizing as a strategic tool. TAM represents the total revenue opportunity if you capture every possible customer, SAM narrows this to the portion you can serve, and SOM focuses on what you can realistically win in the near term. Calculating these metrics requires defining your product scope, segmenting your market, choosing realistic revenue metrics, applying top‑down or bottom‑up methods, adjusting for constraints, performing sensitivity analysis and validating against external benchmarks.
Segmentation is vital because audiences have shifted dramatically in recent years; failing to segment risks wasted resources. Competition and penetration rates further refine your SOM, ensuring your targets reflect reality rather than aspiration. Present your market sizing with clear visuals, transparent assumptions and multiple scenarios, and align it with your product and fundraising roadmap.
Ready to get started? Gather industry data, build a simple spreadsheet model, and iterate. As your startup grows and you collect more customer data, revisit and refine your TAM, SAM and SOM. The goal isn’t to produce a perfect number but to build a shared understanding that guides strategic decisions and demonstrates to investors that you’ve done your homework.
FAQs
1) How to calculate TAM for a startup?
Start by defining your product and identifying your potential customer segments. Choose a realistic revenue metric (e.g., ARR per customer) and use either a top‑down approach (industry revenue × your share) or a bottom‑up approach (number of customers × revenue per customer). Adjust for constraints and perform sensitivity analysis to build low, base and high scenarios. Finally, validate your numbers against industry benchmarks.
2) How to calculate market size for a startup?
Market size can refer to TAM or SAM. To calculate the overall market, research industry reports for total spend and number of potential customers. Multiply the number of potential customers by the average revenue per customer to get TAM. Then narrow to segments you can serve to determine SAM.
3) What is the formula for the total addressable market?
A simple formula is: TAM = total number of potential customers × average revenue per customer. This can be adapted for unit sales or subscription models. Use credible data sources and adjust for pricing tiers.
4) Is TAM based on annual revenue?
Usually, yes. Most TAM calculations use annual revenue per customer (e.g., annual contract value) to standardize numbers and align with financial projections. For transactional businesses, you might use annual purchase frequency multiplied by average order value.
5) When should you prefer bottom‑up vs. top‑down?
Bottom‑up approaches are preferable when you have granular data about your customers and pricing. They produce more realistic estimates and tie directly to operational assumptions. Top‑down methods are helpful early on or for sanity checks, but they can be too coarse if not adjusted. A hybrid approach that triangulates both increases credibility.
6) How often should you revise your TAM estimate?
Revisit your TAM annually or when significant market shifts occur (e.g., regulatory changes, new competitors, major pivots). Markets evolve, especially post‑COVID; regularly updating your model ensures your strategy remains aligned with reality.

check out these related blogs


.webp)


.avif)