When I work with early‑stage founders and product teams, one question always comes up: how big is the opportunity? Investors ask it, new hires ask it, and even our own teams ask it. If you can't show that there is real upside, you risk building a wonderful solution for a tiny group of people. In fact, research from CB Insights found that around 70 % of startups fail because they never figured out their market size. Getting your addressable market wrong isn't just an academic error—it’s the difference between a lifestyle project and a company with long‑term potential.
This guide will show how to determine addressable markets without hype. I’ll explain the difference between Total Addressable Market (TAM), Serviceable Addressable Market (SAM) and Serviceable Obtainable Market (SOM), share simple methods to estimate them, and illustrate why good segmentation matters. I’ll also share patterns I’ve seen while advising software and artificial‑intelligence‑driven startups. By the end, you’ll have a clear framework to determine your addressable market and use that insight to make better product and funding decisions.
What is the addressable market and why does it matter?
Total Addressable Market (TAM) is the maximum revenue you could earn if every potential customer bought from you. It’s the universe of demand for your category. Serviceable Addressable Market (SAM) is the portion of the TAM you can realistically serve given your focus, geography and offering. Serviceable Obtainable Market (SOM) is the fraction of the SAM you can win in the short term; it reflects competition, resources and traction. Think of them as nested circles: SOM sits inside SAM, which sits inside TAM.
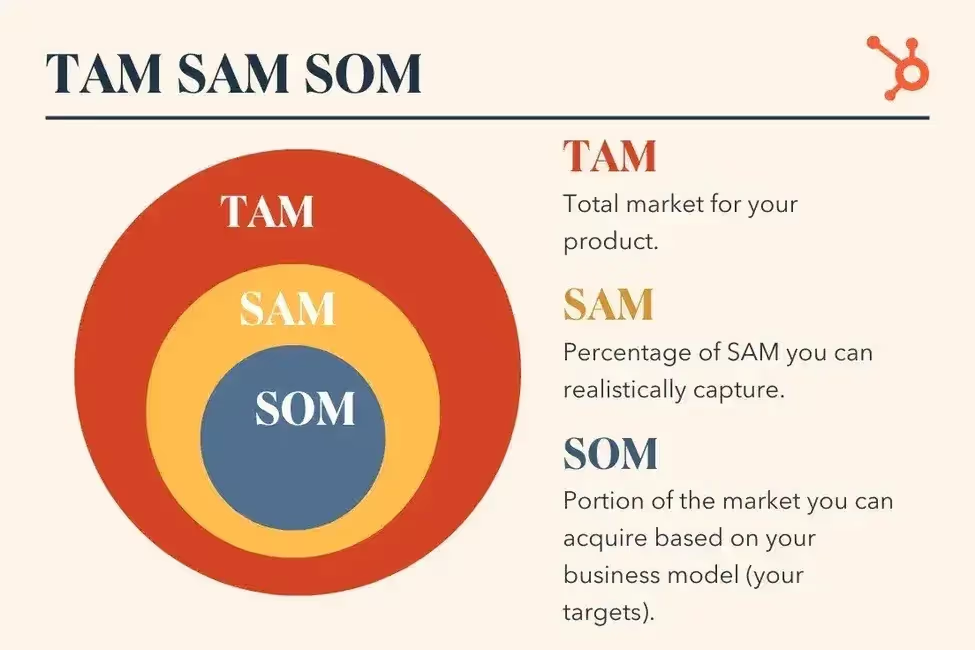
The Gust de Backer model summarises it well. It calls TAM the largest market you could serve, SAM the market you could reach now, and SOM the market you can reach with your current resources. This framework allows you to break down a massive opportunity into manageable chunks.
Why founders and product teams should care
A clear addressable market estimate helps you:
- Prioritise wisely. When your team has limited time and money, focusing on the right segment matters. Without it, you might spend two years building for a $10 million market when a $1 billion opportunity sits next door.
- Justify investment. Investors expect a narrative about market size. Startups with solid TAM research raise around 40 % more funding, and those that keep their analysis updated reach product‑market fit three times faster.
- Plan capacity. Market size informs hiring, marketing spend and product roadmaps. It’s your compass for growth.
Common pitfalls
It’s tempting to inflate your TAM by counting everyone in the world. Resist that. HubSpot’s guidance emphasises that TAM represents potential demand but you’ll only capture a portion. Another pitfall is ignoring friction. Gust de Backer notes that you need staff, money, brand recognition and location to reach your SOM. Overlooking these constraints will make your projections unrealistic. Finally, don’t rely on a single top‑down number. Investors know when assumptions are thin.
Do the groundwork before you estimate anything
Market sizing isn’t just about maths—it starts with understanding who you serve and why. Here’s how I approach the foundations.
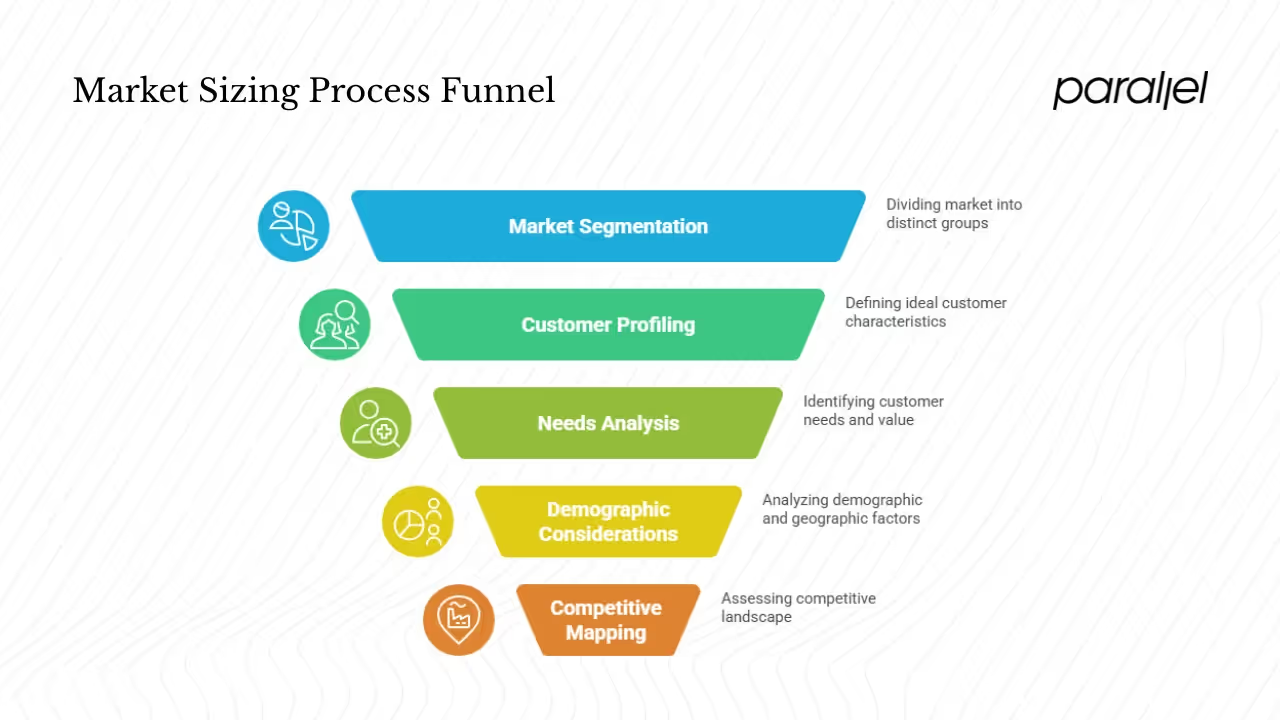
1) Segment your market deliberately
Very few products serve everyone. Splitting the wider market into meaningful segments makes it easier to target and to price. You might segment by:
- Industry or use case: Are you serving fintech, healthcare or retail? Each has different budgets and regulations.
- Company or consumer size: Enterprise clients behave differently from small businesses or individual users.
- Buyer behaviour: What jobs are people trying to get done? Are they looking to save time, comply with regulation or gain insight?
- Channel: Do customers self‑serve, or do you need a direct sales team?
In business‑to‑business software, a common approach is to combine vertical (e.g., financial services) with size (e.g., mid‑market companies). When you run surveys and interviews, patterns emerge: early adopters may cluster in a niche you didn’t expect.
2) Define your ideal customer profile and personas
An ideal customer profile (ICP) is a description of companies or individuals most likely to buy. Define it with attributes such as budget, growth phase and openness to change. Then craft buyer personas for decision‑makers and end‑users. Use qualitative research and secondary data to validate your assumptions. You’ll rarely hit the mark on the first try—refine as you learn.
3) Understand needs and willingness to pay
It’s not enough to know how many potential customers exist; you need to know why they would buy. Map pains to your features and think about the value they receive. Value‑based pricing can reveal surprising opportunities. For example, if you reduce churn by 10 % for subscription businesses, what is that worth to them annually? When I worked with an early SaaS team, we learned that a one‑week improvement in time to first value mattered more than another feature. That insight changed our pricing model and messaging.
4) Consider demographics, firmographics and geography
Consumer markets often break down by age, income, education and motivation. Business markets use firmographics such as industry, revenue and headcount. Geography still matters: regulations, payment infrastructure and adoption vary widely between countries and even between urban and rural areas. In 2025, CRM adoption has grown globally, but adoption rates and budgets differ: for example, the CRM market is projected to top $112 billion in 2025 and could grow to about $262 billion by 2032kixie.com, yet regional adoption will shape your SAM.
5) Map the competitive scene and market dynamics
Who already serves your target? Identify direct competitors, substitutes and alternatives. Look at market maturity, adoption curves and regulatory changes. Keep in mind that some players, especially incumbents, may dominate distribution. Some markets like machine‑learning‑driven software are growing fast—research shows that the global artificial‑intelligence market is valued at around $391 billion today and could reach $4.8 trillion by 2033, growing at roughly 20 % per year. Such growth can make a TAM look exciting, but it also attracts heavy competition.
Methods to estimate market size
Once you know who you’re targeting, you can estimate the size of your opportunity. Here are three approaches I often use, along with guidance on when each makes sense.
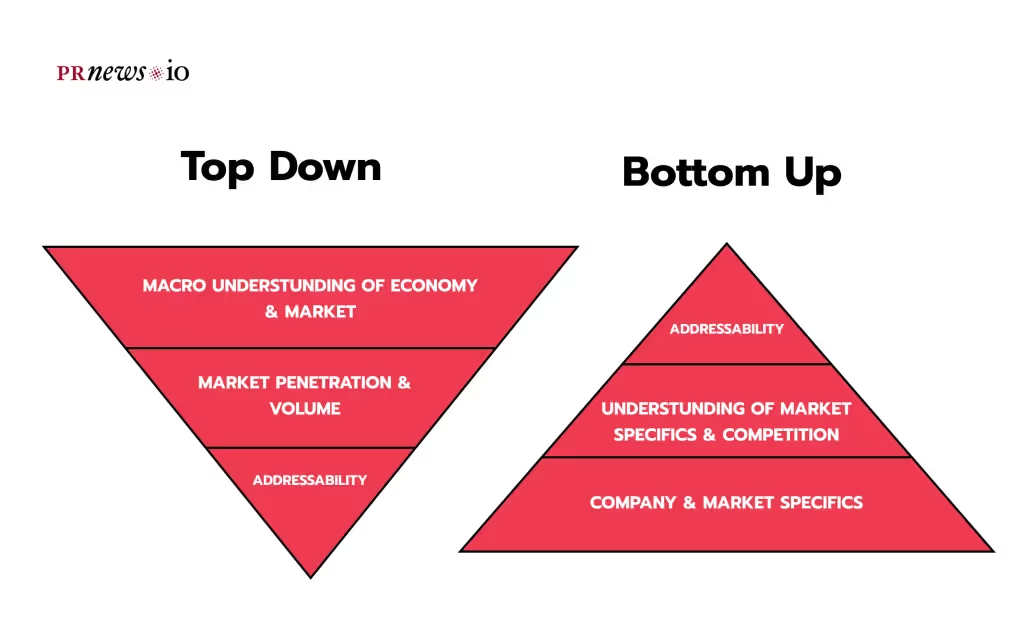
Top‑down approach
Top‑down sizing starts with published market numbers and narrows them using sensible filters. For instance, if a Gartner report says the global CRM market will be $112 billion in 2025kixie.com, you might apply a regional filter (e.g., 30 % in Asia Pacific) and an industry filter (e.g., 10 % is healthcare) to get your TAM. You then adjust for your target segment to produce your SAM. Top‑down analysis is quick and uses credible third‑party data. The downside is that it can be too coarse; the numbers often hide nuances such as customer budget constraints or new market segments.
I only use top‑down as one input, never as the sole answer. It's a sanity check that your bottom‑up estimate isn't wildly off.
Bottom‑up approach
Bottom‑up sizing starts with your unit economics and builds up. Calculate:
- Number of potential customers. Use census data, firmographic databases or industry associations. For example, how many companies in India have revenue between ₹10 crore and ₹100 crore?
- Average annual revenue per customer (ARR). Use pilot sales or competitor pricing to estimate how much each customer would pay per year.
- Multiply the two numbers to estimate your TAM.
From there, apply your segmentation to derive SAM, and adjust for realistic capture rates to derive SOM. This approach is more credible to investors because it’s grounded in your product and pricing. It also uncovers whether your business model can support your ambitions. When I worked with a SaaS tool for remote teams, we discovered that although there were thousands of potential customers, only a few hundred matched our ICP and had budgets above $5,000 per year. That was our SAM.
Value theory or use‑case potential
When you’re creating a new category or tackling a problem where no direct spending data exists, you can estimate the economic value your solution unlocks. For instance, if your product saves ₹1,000 per employee per month, and you believe 20 % of employees in your segment will adopt it, you can estimate the revenue you might capture. This method is speculative but useful for early innovation. It’s particularly relevant in emerging fields like machine‑learning‑driven design, where spend data is scarce.
Hybrid and sensitivity analyses
I often blend top‑down and bottom‑up approaches. Start with a published number, cross‑check with your own unit economics, then build low, base and high scenarios. Present ranges instead of single points and show how changes in conversion rate or pricing influence your TAM. Sensitivity tables help stakeholders see how assumptions drive outcomes and avoid false precision.
From TAM to SAM to SOM – narrowing the focus
Estimating TAM is only the first step. To build a plan, you need to shrink that number to something actionable.
Turning TAM into SAM
Begin with filters that reflect the segment you can actually reach:
- Geography. You might be based in India but plan to expand to Southeast Asia next year. Start with your home country.
- Product scope. If your initial release only solves one job, remove other use cases from TAM.
- Regulatory or technical constraints. Data‑residency laws may prevent you from serving certain regions.
Apply these filters sequentially. For example, suppose the global CRM TAM is $112 billionkixie.com. If you only sell to mid‑market companies in India, and mid‑market accounts for 5 % of global CRM spend, your SAM becomes $5.6 billion. If your current distribution limits you to English‑speaking urban centres, that might cut the number in half again.
Turning SAM into SOM
Now bring in your execution capacity and competition. Factors include:
- Sales and marketing budget. How many customers can your team realistically reach this year?
- Conversion rates and churn. Use pilot data or industry benchmarks. If your website converts 3 % of visitors and half of them become paying customers, adjust accordingly.
- Competitive intensity. Are there entrenched players? Some markets require years of trust‑building.
If your SAM is $100 million and you believe you can capture 1 % in the first year, your SOM is $1 million. Use this figure to set targets, budgets and investor expectations. In a few years, as you expand to new segments or regions, your SAM and SOM can grow. Show these trajectories with plausible adoption curves.
Growth over time
Your SOM isn’t static. Plan for how it expands as you launch new features, hire salespeople or move up‑market. For instance, a consumer app might start with 50,000 paying users, and then triple users by year three as retention improves. Show how TAM itself may grow; the CRM example shows a projected increase from $112 billion in 2025 to over $262 billion by 2032kixie.com. A growing TAM means your ceiling rises over time.
Data sources, assumptions and validation
Where to find data
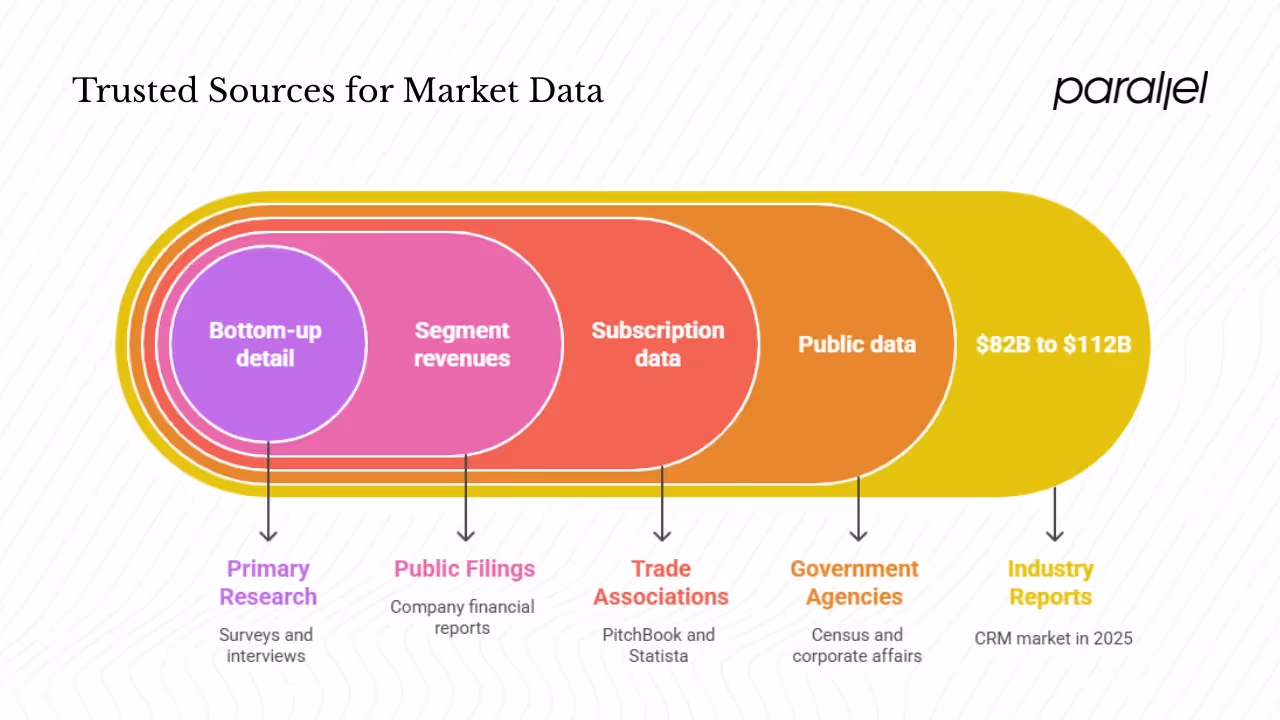
Good market estimates rely on solid data. Here are sources I trust:
- Industry reports from firms like Gartner, IDC, Forrester or Fortune Business Insights. For example, multiple sources estimate the CRM market between $82 billion and $112 billion in 2025 and $163 billion to $262 billion by 2030–2032kixie.com.
- Government and statistical agencies such as the U.S. Census Bureau or India’s Ministry of Corporate Affairs.
- Trade associations and market research providers like PitchBook or Statista (though data behind paywalls may require a subscription).
- Public company filings, which often reveal their segment revenues.
- Primary research: surveys, interviews, and pilot sales provide bottom‑up detail and reveal willingness to pay.
Be transparent with your assumptions
For each assumption—penetration rate, average spend, number of customers—show your reasoning and source. In my financial models, I include footnotes linking to reports or internal data. Provide ranges for uncertain variables. This transparency builds trust and helps you update your model as new data arrives.
Validate and stress‑test
Cross‑check top‑down and bottom‑up estimates. Ask: does the result make sense given what similar companies report? Look at how your revenue forecast compares to your SOM. Use sanity checks: if your SOM is larger than your SAM, something is off. Run sensitivity analyses: how would a 10 % decrease in conversion or a 20 % price cut change your TAM? Such tests prevent overconfidence.
Real‑world examples
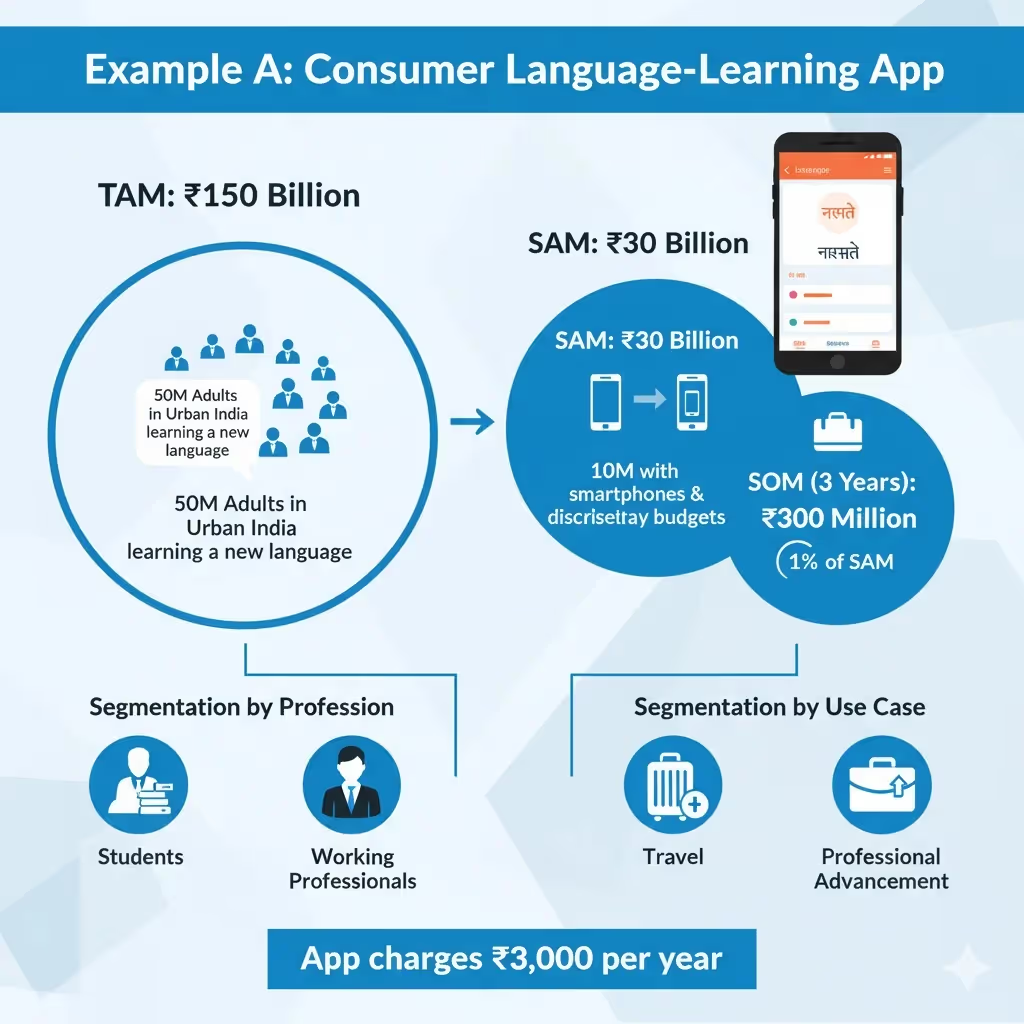
Example A: consumer language‑learning app
Imagine you’re building an app to help adults learn Hindi. You charge ₹3,000 per year. There are 50 million adults in urban India who want to learn a new language. That’s your TAM: ₹150 billion. Your SAM may be those with smartphones and discretionary budgets—perhaps 10 million people (₹30 billion). If you believe you can reach 1 % of that group in three years, your SOM is ₹300 million. To refine further, you might segment by profession (students vs. working professionals) and by use case (travel vs. professional advancement).
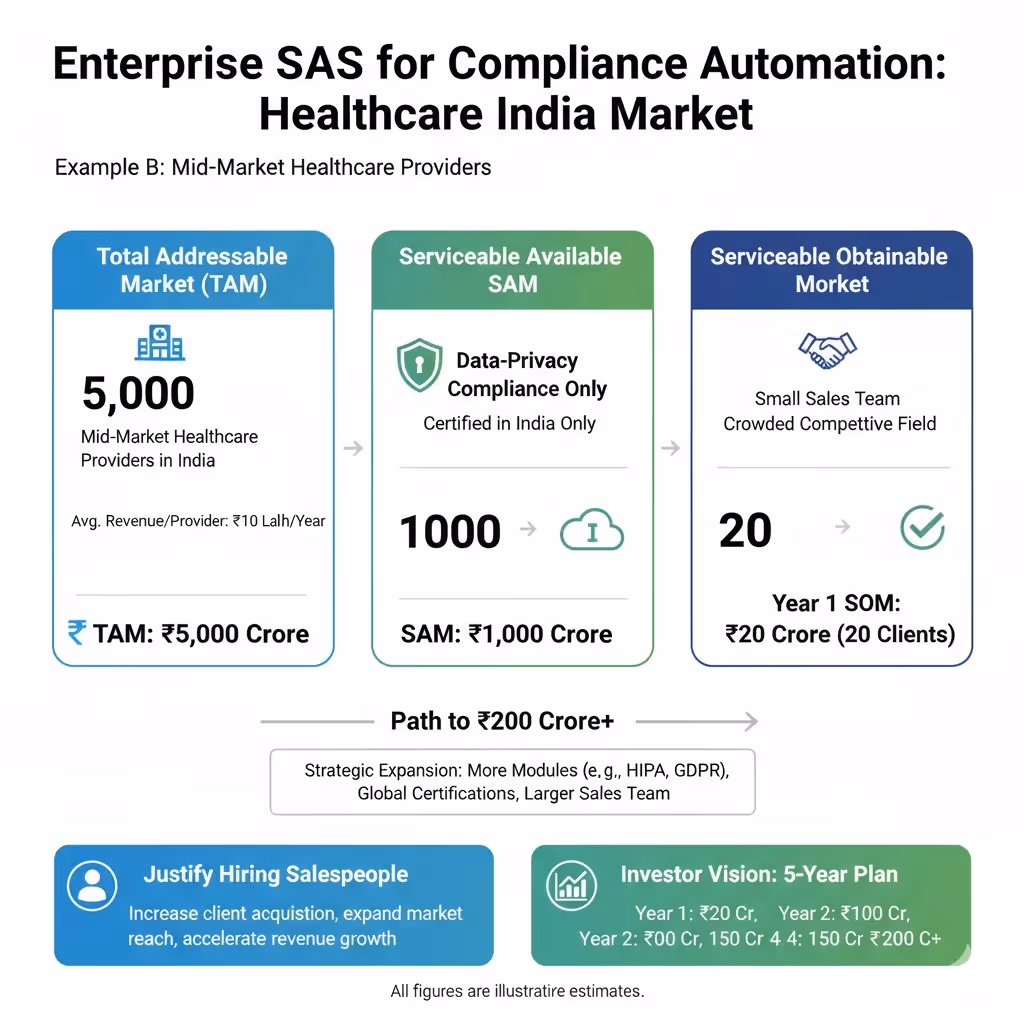
Example B: enterprise SaaS for compliance automation
Consider a tool that automates compliance for mid‑market healthcare providers. There are 5,000 such providers in India, and each would pay roughly ₹10 lakh per year. Your TAM is ₹5,000 crore. However, your product currently covers only data‑privacy compliance, and you are certified only in India, so your SAM is perhaps 1,000 providers (₹1,000 crore). With a small sales team and a crowded competitive field, you may plan to win 20 clients in the first year—₹20 crore in SOM. Use this model to justify hiring salespeople and to show investors a path to ₹200 crore over several years.
Patterns from artificial‑intelligence‑driven products
Working with machine‑learning‑based startups, I’ve seen teams overestimate adoption by assuming the technology itself is the draw. The Nielsen Norman Group warns that presenting a product as “powered by AI” confuses users and does not make a clear value promise. Instead, successful products focus on a single capability and serve one segment well. When teams start with user value—such as saving time or reducing errors—adoption follows. Keep this in mind when projecting SOM for machine‑learning‑heavy products: adoption will depend on trust and clarity, not just technological novelty.
Using your market model in strategy and roadmaps
Prioritisation and market entry
Once you have a TAM–SAM–SOM model, choose the segment where you can win first. Look for groups with urgent problems, clear budgets and low competitive pressure. This is your beachhead. Focus your messaging, features and go‑to‑market motion there. After you gain traction, expand to adjacent segments.
Resourcing and go‑to‑market planning
Use SOM projections to plan headcount, marketing spend and product investments. If your model shows ₹50 crore in attainable revenue over two years, you might justify hiring a five‑person sales team. If it shows ₹5 crore, a self‑serve model with lighter support may be wiser. Align your OKRs to market capture metrics—number of deals, conversion rates, average contract value.
Communicating with investors and stakeholders
Present your market numbers clearly. Show the nested circles of TAM, SAM and SOM. Attach footnotes to assumptions and include ranges. Investors appreciate seeing both optimistic and conservative scenarios. The Business Initiative guide points out that founders who deeply understand their TAM stand out and perform better.
Iterating over time
Treat your market model as a living document. As you get real conversion data, adjust your assumptions. New regulations or competitor moves will change your SAM. New features or geographic expansion will enlarge your TAM. Regular updates—quarterly is common among high‑growth firms—keep your strategy grounded in reality.
Challenges and ways to handle them
- Data scarcity. Niche markets often lack published numbers. Use proxies: find similar industries, look at adjacent regions, or build bottom‑up estimates from first principles. When we worked with a compliance‑automation startup serving a new regulation, we used the number of covered entities and the fines they risked to estimate willingness to pay.
- Rapid market change. Technological and regulatory shifts can inflate or shrink your TAM. The CRM market’s projected jump from $112 billion to $262 billion by 2032kixie.com illustrates how quickly things can move. Update your model often.
- Overconfidence. It’s easy to assume you’ll capture a large share. Test your assumptions against conversion data and competitor case studies. Build conservative and aggressive cases.
- Confusing TAM with SAM or SOM. Make sure stakeholders know which number you’re referencing. A TAM slide without a clear SAM and SOM can signal a lack of focus.
- Biased estimates. Founders sometimes choose overly optimistic numbers to impress investors. It usually backfires. Present a range and discuss uncertainties openly.
Closing thoughts
Market sizing is both science and craft. You start by understanding your segment and ideal customers, then use a mix of top‑down, bottom‑up and value‑based methods to estimate TAM. From there you apply filters and realistic assumptions to arrive at SAM and SOM. Use credible data sources, document your reasoning and test your assumptions. The process isn’t a one‑time task; high‑growth companies revisit their market models regularly.
The stakes are high. An inaccurate or inflated estimate can sink your pitch or lead you to misallocate resources. Yet a thoughtful model, grounded in user value and realistic execution, can guide product decisions and build investor confidence. As Nielsen Norman Group reminds us, successful products begin by doing one thing well for a clearly defined segment. Combine that focus with a robust market model, and you’ll be well prepared to answer the question that every stakeholder asks: how to determine an addressable market.
FAQ
1) How do you determine the addressable market?
Start by clearly defining your customer segment. Use a top‑down approach (industry reports), a bottom‑up approach (number of customers × average spend) and, if needed, a value‑based method. Compare results and create low/base/high scenarios. From there, apply filters for geography, product scope and constraints to move from TAM to SAM and SOM.
2) How to know the total addressable market?
Find credible third‑party estimates for your industry. For example, multiple sources project the CRM market between $82 billion and $112 billion in 2025kixie.com. Adjust for your target region and segment. Alternatively, multiply the number of potential customers by what they would pay each year.
3) What defines an addressable market?
It’s the portion of a total market that you can realistically target, given your product focus, customer profile, geography and distribution. The TAM is the whole universe of demand; the SAM and SOM narrow it down based on serviceability and execution.
4) What are the five strategies to determine market size?
You can: (1) use top‑down estimates from industry reports; (2) build bottom‑up models from customer counts and pricing; (3) estimate economic value created by your solution; (4) use analogies to similar markets when data is scarce; and (5) combine these approaches with sensitivity analyses to triangulate.
5) When should you update your market model?
At every funding round, major product pivot or geographic expansion, or when you gather meaningful new data. High‑growth companies often revisit their model quarterly to ensure strategic decisions stay grounded in current realities.

check out these related blogs


.avif)


.webp)