Visitors are more than numbers on an analytics dashboard. They are people who hover, scroll, click and sometimes bail without warning. Early‑stage founders and product managers often ask how to track user activity on websites because they sense that sessions and pageviews miss the story.
In this article I’ll show you how to go from surface metrics to rich behavioural insight. Drawing on experience helping machine‑learning‑powered SaaS teams at Parallel, I’ll cover methods like click maps, heat maps, session replays, event tracking and funnels.
You will learn what to measure, how to collect it, how to interpret it and how to respect privacy. I’ll also point to recent research and data to ground our recommendations.
Why does understanding user behaviour matter?
Basic analytics tell you how many people visited, but they don’t reveal what those people did. User activity spans pageviews, clicks, scrolling, time on page and navigation paths. Behaviour analytics platforms turn these actions into events—such as “clicked submit” or “watched demo”—that can be aggregated to find patterns. Contentsquare’s behaviour guide explains that scroll depth shows how far visitors travel down a page and that aggregated scroll maps show where most people drop off. They also define bounce rate—the percentage of visitors who leave without interacting further. Tracking micro‑conversions, like completing onboarding steps, helps teams identify where users stall.
Behavioral data has a financial impact. In 2025 a roundup of UX statistics noted that 88% of consumers will not return after a bad experience and that 74% of visitors are more likely to come back when the mobile experience is good. Another study found that a one‑second delay in page load can cut conversions by seven percent. When you understand how people interact, you can remove friction and increase revenue. At Parallel we helped a founder realise that few visitors scrolled far enough to see his pricing table; moving it above the fold lifted sign‑ups.
For early‑stage teams, the question of how to track user activity on websites isn’t academic. It’s about making the right design changes with limited time and resources. A solid behavioural layer complements interviews and surveys by showing what people actually do.
Methods to see what users do on the website
When people ask how to track user activity on a website, they usually picture heat maps. Heat maps are one method among many. This section describes the main approaches, what they measure and why they matter.
1) Click maps and heat maps
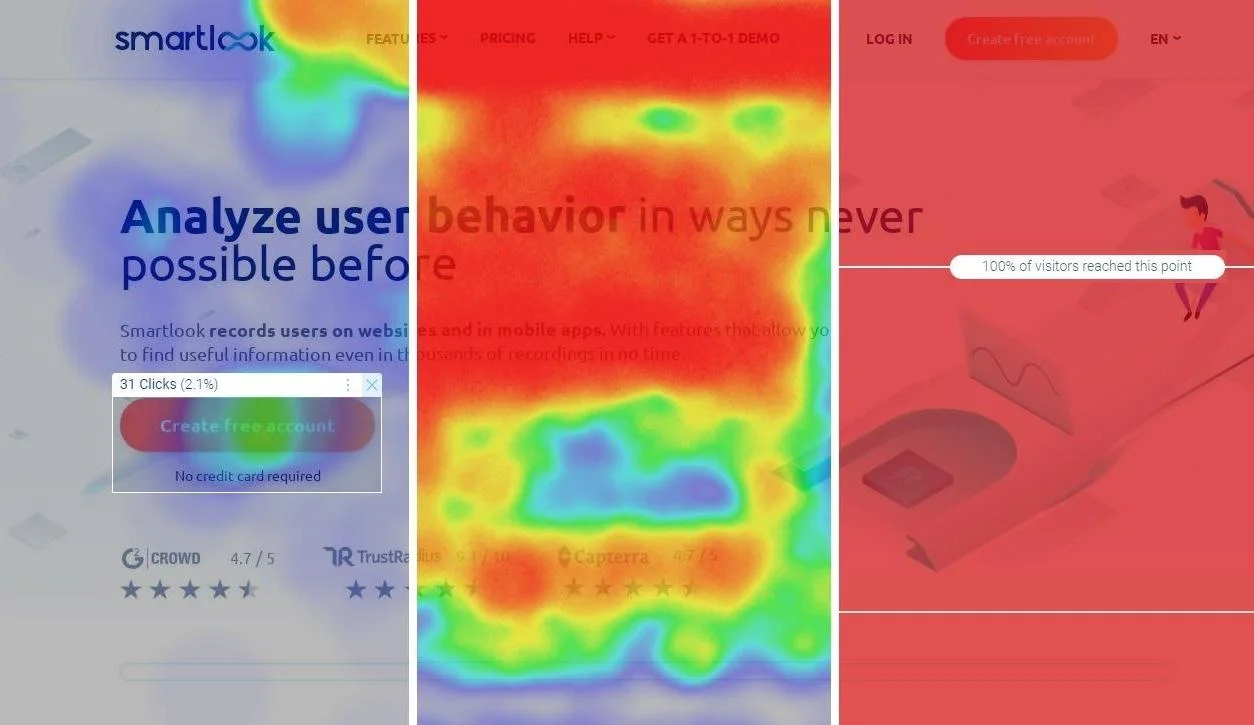
Click maps visualise where users press on a page. They show popular spots and reveal dead zones where nobody clicks. If a decorative icon looks like a button, click maps expose misclicks. Heat maps expand this idea to show intensity of all interactions with colours from red (many) to blue (few). Variants include hover maps that record pointer movement, move maps that trace cursor paths and scroll maps that show how far people travel down a page. Contentsquare notes that scroll depth helps you check whether people reach important elements like pricing. When we paired scroll maps with click maps on a client’s sign‑up page, we learned that only one‑third of visitors saw the “Create account” button, explaining low conversions.
2) Session replays
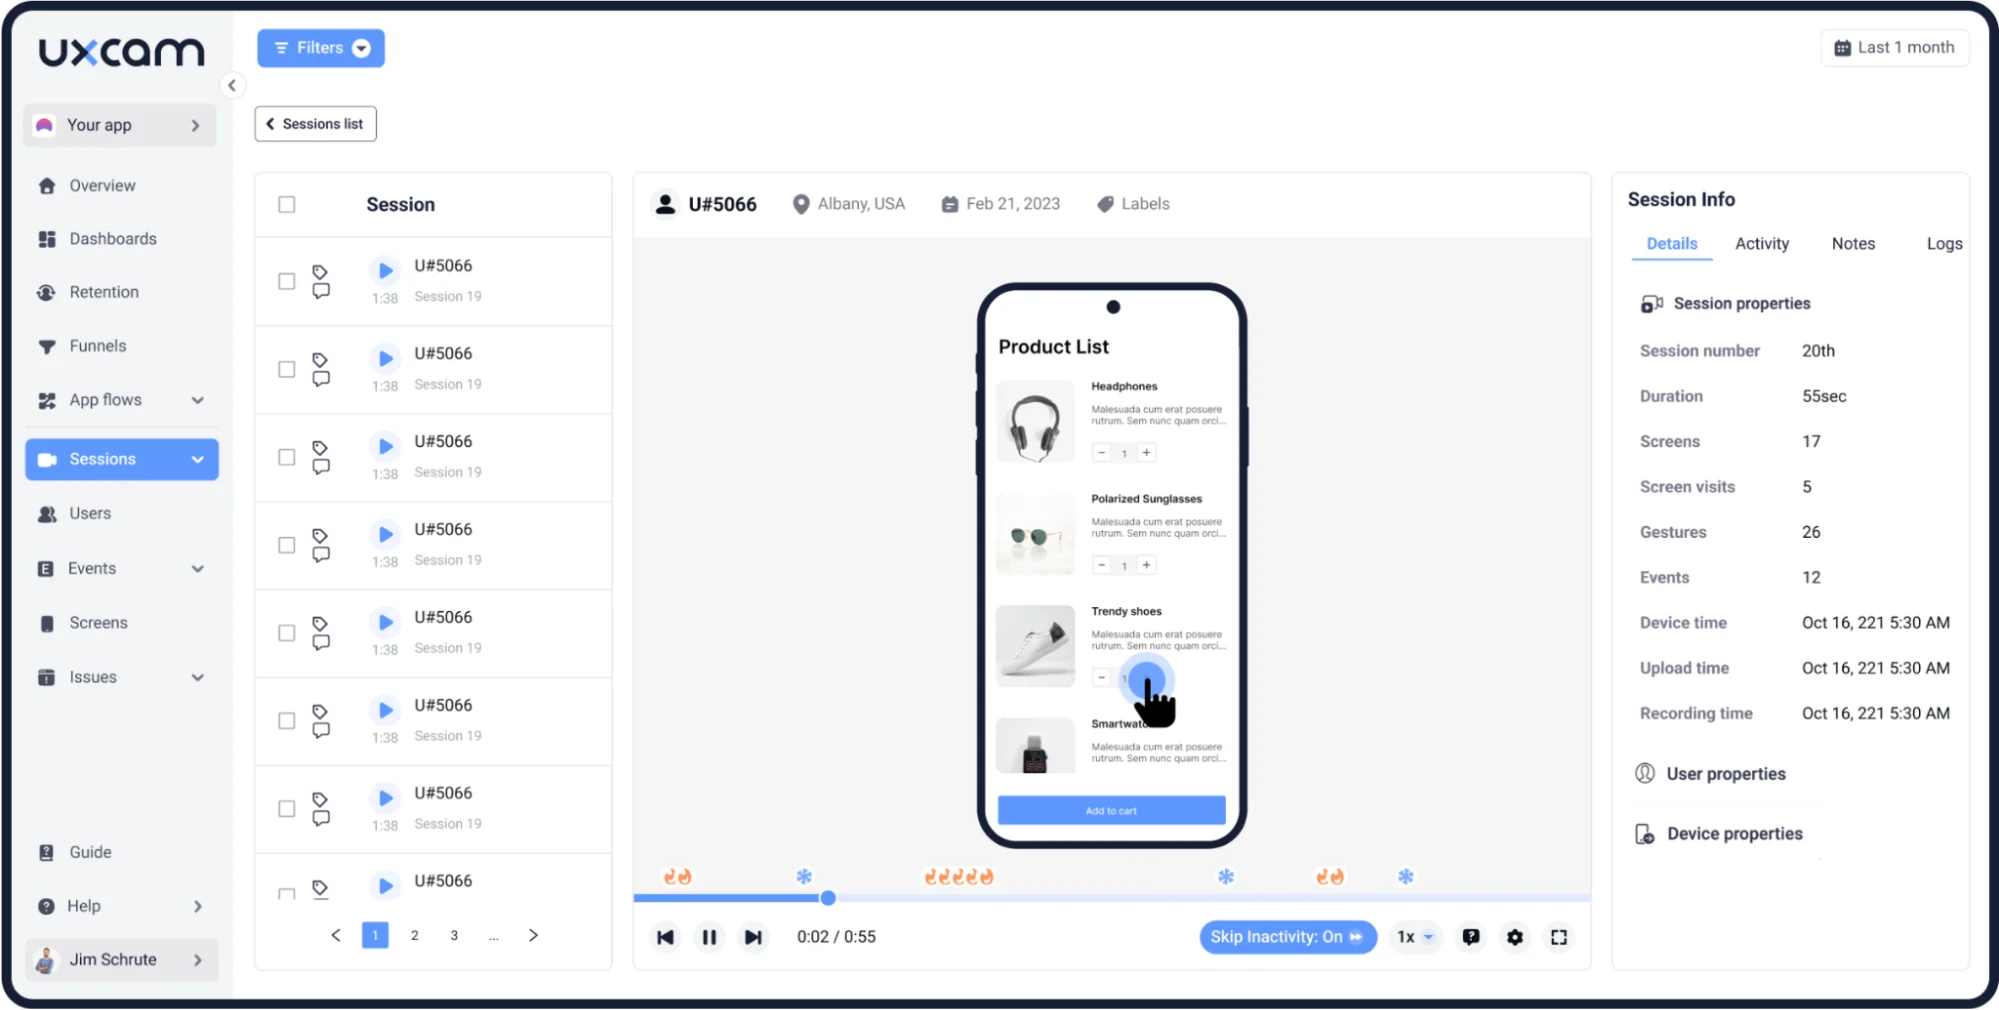
Session replays let you watch a recording of a user’s path as if you were looking over their shoulder. The UXCam guide describes session recording as video replays that capture gestures such as taps, swipes and long presses. It highlights benefits like identifying churn points and improving usability, and warns that full recordings can be time‑consuming and require masking sensitive data. We use replays sparingly: watch a handful around a problem area instead of bingeing entire sessions. They are particularly useful for spotting “rage clicks”—rapid repeated taps on a non‑responsive element—which Fullstory defines as a sign of frustration.
3) Event tracking
Event tracking is the backbone of behaviour analytics. Each event represents a meaningful action: clicking a CTA, sending details, adding to cart. You can capture events manually by instrumenting your code or by using tools that automatically log interactions. Clear naming helps—“click_signup_button” is obvious, “event_42” is not. Tracking micro‑conversions as events reveals drop‑off points. For example, if you require five steps to sign up and see that most visitors complete only two, you know where to investigate.
4) Funnels and paths
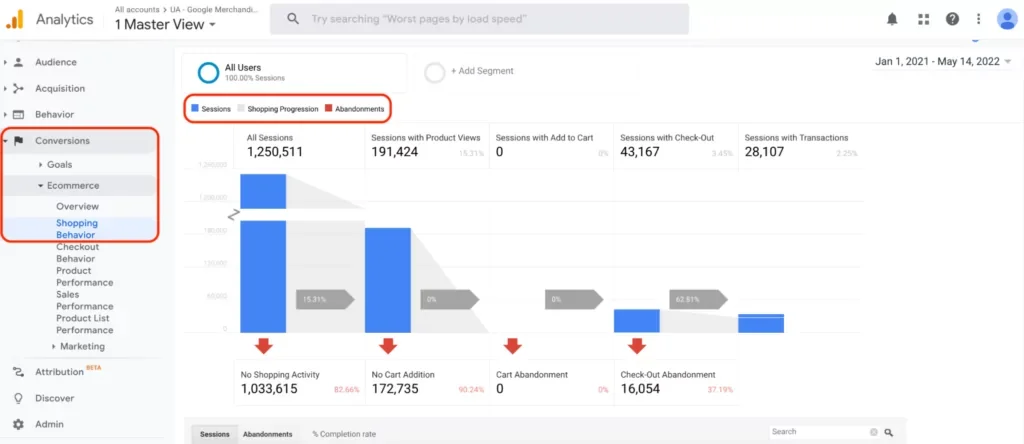
A funnel is a chain of steps leading to a goal such as purchasing a subscription. Funnel analysis shows where visitors abandon; path analysis (sometimes called flow analysis) visualises actual navigation, revealing detours people take. Funnels help test hypotheses (“do we lose folks at the payment step because we ask for card details too soon?”) while path analysis shows unexpected loops. Combined, they answer deeper questions about user behaviour and why people act the way they do.
5) Engagement and conversion metrics
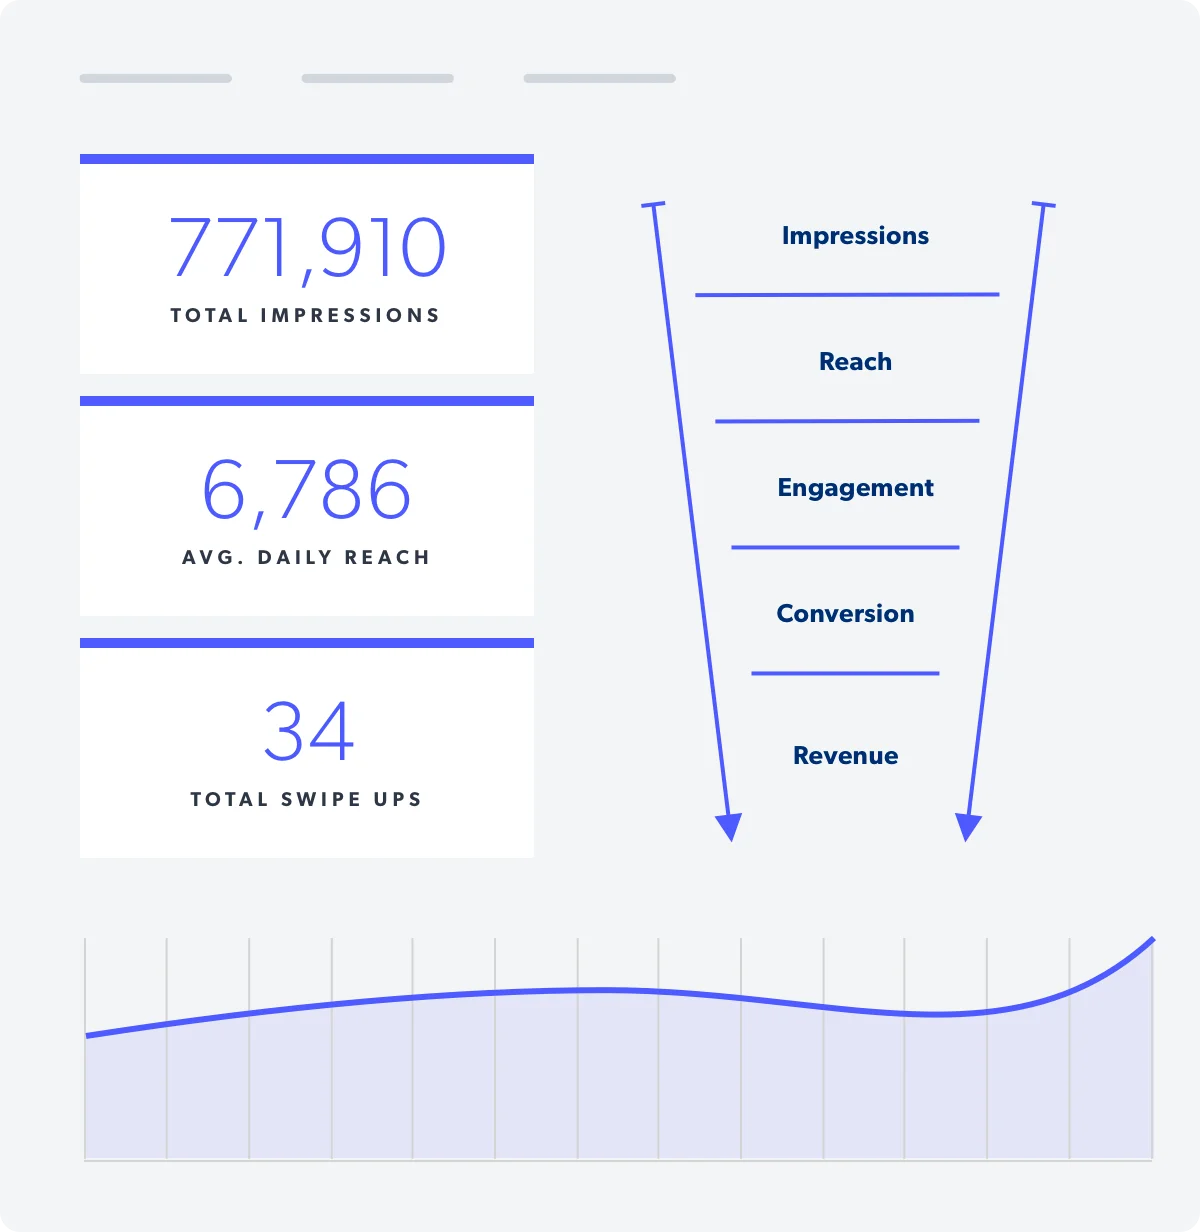
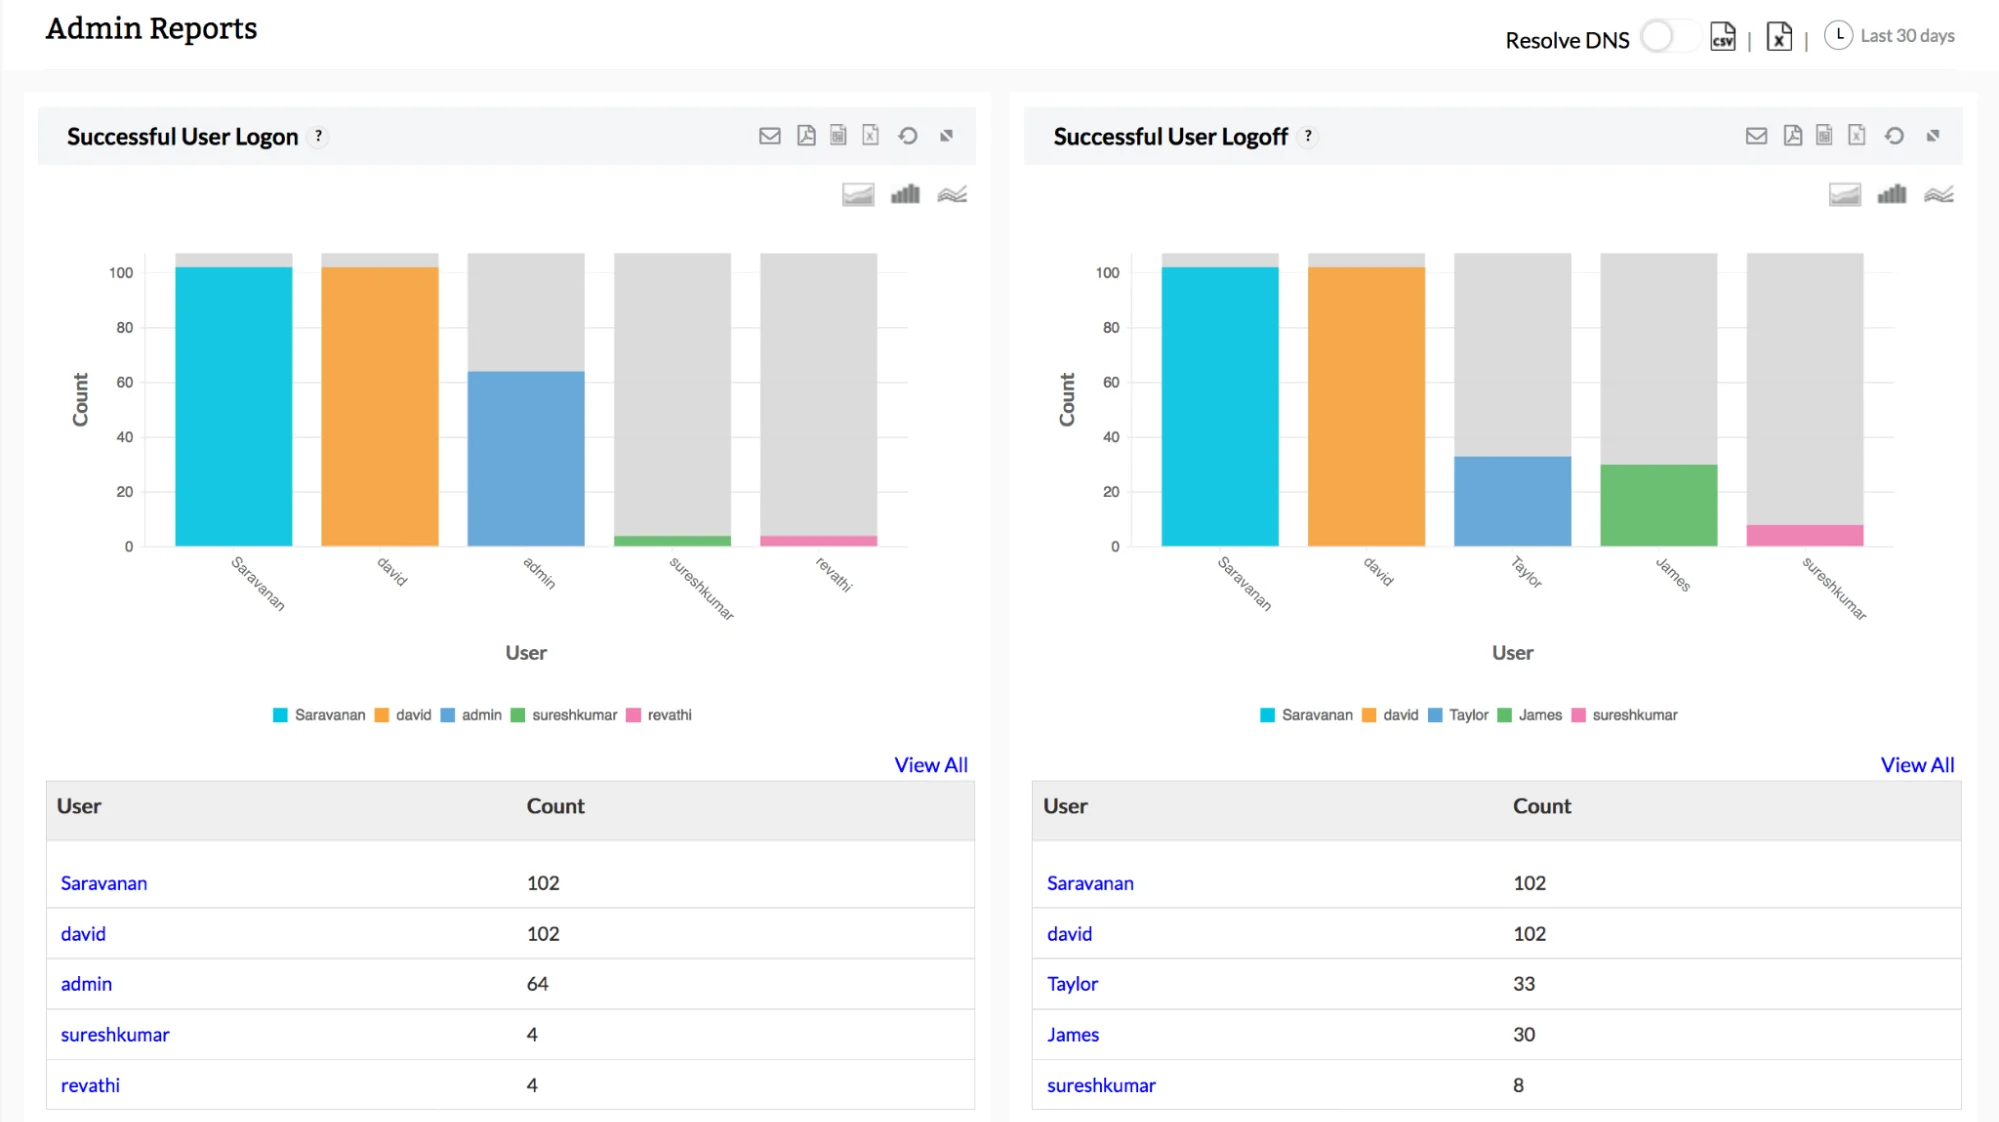
Aside from individual clicks and scrolls, engagement metrics measure how long people stay, how often they return and whether they bounce. Bounce rate indicates whether visitors find what they need; high bounce on a paid ad might mean poor fit or slow performance. Time on page and dwell time show how engaged visitors are. Conversion metrics tie these behaviours to outcomes—macro‑conversions like purchases and micro‑conversions like sign‑ups or adding a product to cart. Connecting behaviour to business results is the goal of thoughtful analytics.
Setting up your tracking
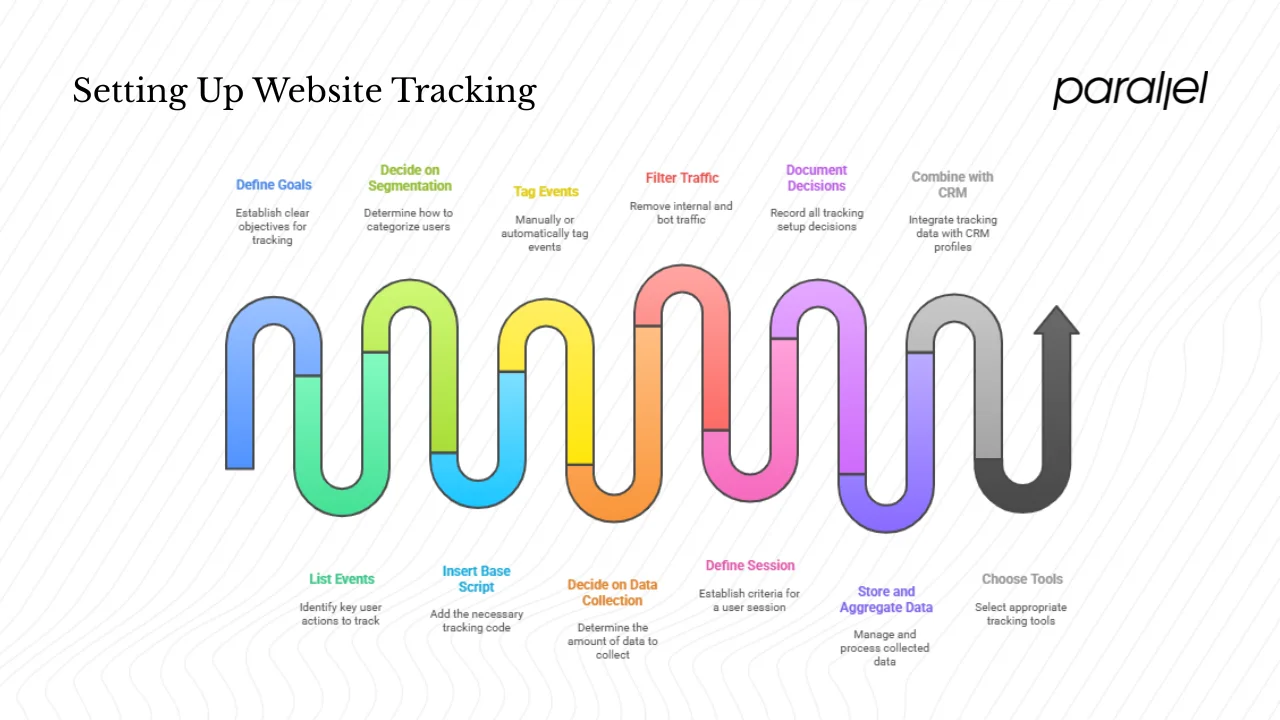
A common mistake is adding tracking scripts without a plan. The plan is the most important step in how to track user activity on a website. Start by defining goals: do you want to increase sign‑ups, reduce drop‑off during onboarding or improve feature adoption? List the events that matter, agree on names, and decide how to segment users—new vs returning, free vs paid, mobile vs desktop.
Most tools require inserting a base script. You can add it manually or use a tag manager. Some platforms automatically collect many events; others need you to tag each one. Autocapture saves time but may gather noise, whereas manual tagging gives precision at the cost of engineering effort. Start simple and expand as you learn.
Decide how much data to collect. Recording every session may slow your site and increase cost. Many platforms let you sample a percentage of sessions. Filter out internal traffic and bots. Define what counts as a session—for example, activity separated by 30 minutes of inactivity. Document these decisions so future analyses are consistent.
Event data is stored as logs then aggregated. Understand how long your tool retains raw sessions and how you can export data. When you combine behavioural data with CRM profiles, mask identifiers to protect privacy. Small teams often start with free tools like Hotjar or Crazy Egg for heat maps and upgrade to richer platforms like Contentsquare, Fullstory or Mixpanel as they scale.
Analysing user behaviour
Once your tracking is in place, you’re ready to interpret the data. Start with questions, not dashboards. Ask why a drop‑off happens, then dig into the funnel to see where it occurs. Overlay heat maps and click maps to check whether the call‑to‑action is visible and pressed. Watch session replays at the drop‑off point to understand friction. Fullstory’s article explains that rage clicks—repeated taps on a dead element—signal frustration; in their case study, addressing rage clicks reduced lost bookings by 22% and increased feature usage by 24%. That illustrates how small fixes based on behaviour data can deliver big gains.
Pattern detection involves looking past single sessions. Compare cohorts—people who signed up last month versus this month—or segments such as mobile vs desktop to see trends. Did a new feature change time on page? Did a design tweak change scroll depth? Use these patterns to craft hypotheses. For instance, if scroll maps show visitors don’t reach your pricing table, guess that moving it higher will improve conversions. Run an experiment (A/B test) to verify. Keep experiments simple—test one variable at a time and measure both micro and macro conversions.
Finally, set up monitoring. Dashboards that display bounce rate, scroll depth and conversion rate make it easy to see when something changes. Alerts notify you if a metric drops unexpectedly. Regular audits of your tracking code catch broken events. Analysing data isn’t one time; it’s an ongoing part of how to track user activity on a website.
User activity tracking tools (+ privacy and ethics)
Choosing the Right Tools
No single tool covers every aspect of user tracking. Each serves a different purpose:
- Heat map tools like Hotjar and Crazy Egg are quick to set up and relatively affordable. They help you see where users click and scroll.
- Comprehensive platforms such as FullStory and Contentsquare combine heat maps, session replays, and event analytics. They’re ideal for teams that need deeper segmentation and have a larger budget.
- Event analytics tools like Mixpanel and Amplitude focus on tracking user actions and funnel performance. They can integrate with replay tools to add behavioural context.
Choose your stack based on your company’s stage, budget, and how deeply you need to analyse user behaviour.
Privacy and Compliance
Tracking user behaviour also means handling personal data responsibly. Cookies, when they can identify an individual, count as personal data under privacy laws such as GDPR and the ePrivacy Directive.
To comply:
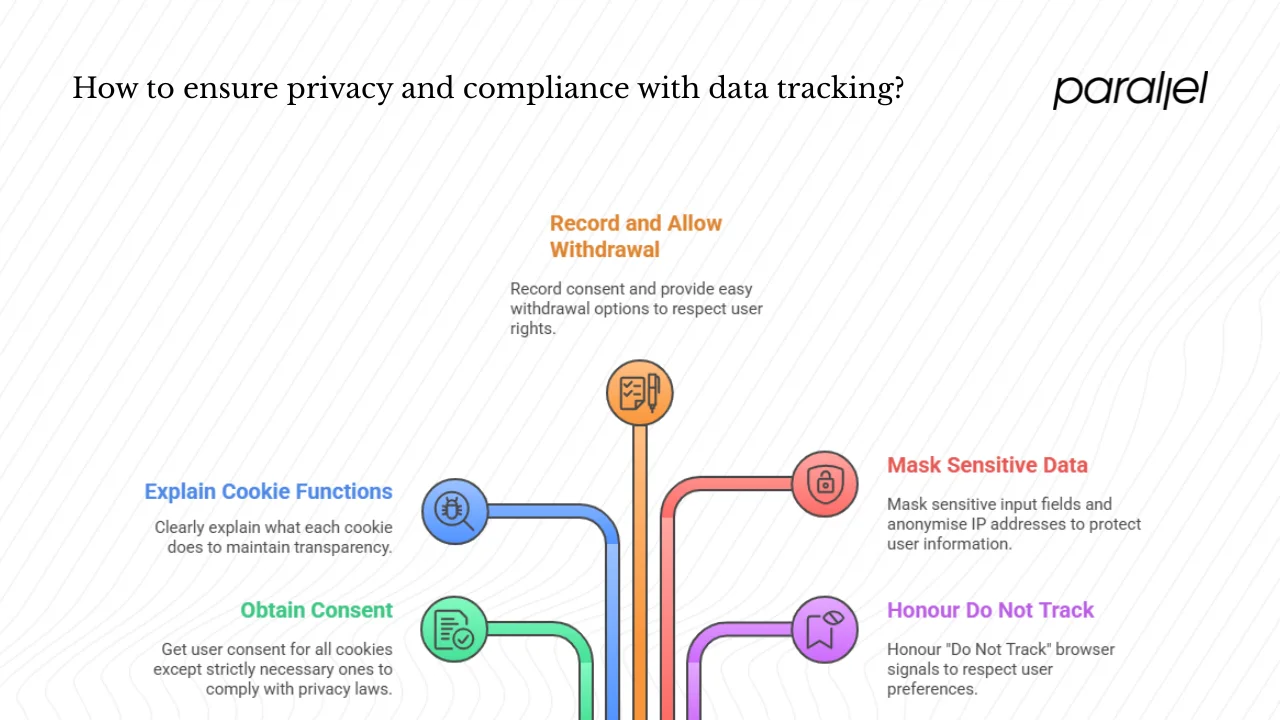
- Get consent for all cookies except those that are strictly necessary.
- Clearly explain what each cookie does.
- Record consent and allow users to withdraw it easily.
- Mask sensitive input fields and anonymise IP addresses.
- Honour “Do Not Track” browser signals.
Ethics in User Tracking
Ethical analytics focuses on understanding behaviour rather than identifying people. Collect only the data you truly need and avoid storing it longer than necessary. Compliance isn’t just a legal requirement—it’s a foundation for trust between you and your users.
Tips from practice
- Start simple: Focus on one or two funnels before instrumenting the product. Over‑tracking generates noise.
- Be consistent: Use clear names for events and stick to them. Mismatched names ruin analysis.
- Sample carefully: Enough data to see patterns, not so much that you harm performance.
- Combine methods: Heat maps show what is visible; session replays show why. Surveys and interviews add human context.
- Share what you find: Product, design and engineering teams should view the same dashboards. Shared insight leads to faster decisions.
- Regular conversations with users: Metrics show what happens; interviews and usability tests reveal why. Pair analytics with calls to uncover context and motives.
- Iterate deliberately: Resist the urge to change everything at once. Develop a clear hypothesis, adjust one element, measure the impact and then decide the next step. This rhythm builds learning into your work.
Conclusion
Learning how to track user activity on a website is like learning to observe. You define the actions that matter, collect data responsibly, ask pointed questions and act on what you see. Behavioural analytics reveals friction that top‑line metrics hide. For early‑stage founders and product managers, it’s a practical way to make confident decisions with limited resources. Start by instrumenting one critical path—such as sign‑up or checkout. Use heat maps, click maps, event tracking and session replays to watch how real users move. Fix what you find, monitor the effect and repeat. With each cycle you will refine the experience and help your product grow.
FAQ
1) How to track user activity on a website?
Define which interactions matter, add a tracking script, label events like clicks and submissions, and use tools such as analytics platforms, heat maps and session replays to collect data. Then analyse patterns and adjust your product. Start small and expand as you learn.
2) Is it legal to track user activity on a website?
Yes, but you must follow data‑protection laws. The GDPR and the ePrivacy Directive classify certain cookies as personal data. You must obtain informed consent for non‑essential cookies and explain what you collect. Mask sensitive information, anonymise IP addresses and allow users to opt out.
3) Can behaviour tracking identify individual users?
Behaviour tools collect interaction data, not real identities. Unless you merge events with login data, they track actions anonymously. It’s good practice to pseudonymise data and avoid recording personal fields.
4) How do I check active users on a website?
Active users are measured by unique sessions or user IDs over a period—Daily Active Users (DAU) or Monthly Active Users (MAU). Define what counts as active, such as performing a meaningful event, and use dashboards in your analytics tool to monitor these figures.

check out these related blogs


.webp)