Building a young product often feels like putting the plane together mid‑flight. You’re iterating quickly, watching users stumble through the interface and then scrambling to fix what went wrong. Today, there’s a better way. Predictive analytics in UX design lets product teams anticipate what users will do rather than guess after the fact. By combining historical data with real‑time signals, models can forecast behaviour and drive the experience accordingly. This means faster cycles, fewer people dropping off and a more engaging product. For founders, product managers and design leads who are trying to do more with less, learning how to incorporate predictive analytics in UX design is no longer optional — it’s a tool for survival and differentiation. In the next sections we’ll look at what predictive analytics in UX design means, why it matters for early‑stage teams, how it works, and practical steps for using it.
What predictive analytics means for UX?
Predictive analytics is a branch of data science that uses historical and current data to forecast future states. In a product context, that might be predicting how many people will upgrade next week or which marketing campaign will perform best. When applied to user experience, predictive models for UX use click‑throughs, session length, device type and other signals to anticipate what someone is about to do and then adapt the interface. Instead of simply reacting to a user’s action, the system quietly adjusts content, layout or the number of steps required so that it meets them where they are.
Traditional UX research is reactive. Designers run interviews, usability tests and surveys; they identify issues, propose changes and hope the next release solves them. This cycle repeats until resources run out or the product stabilises. Predictive analytics in UX design flips that mindset. It uses behaviour‑prediction models and adaptive interfaces to forecast friction points and deliver personalised interactions before problems arise. An e‑commerce site might, for example, predict that a new visitor who scrolls quickly is likely to abandon their cart; it could then surface a one‑click checkout or an incentive earlier in the flow. Netflix famously suggests content by analysing viewing histories and similar profiles, turning a global streaming catalogue into a custom experience for each viewer.
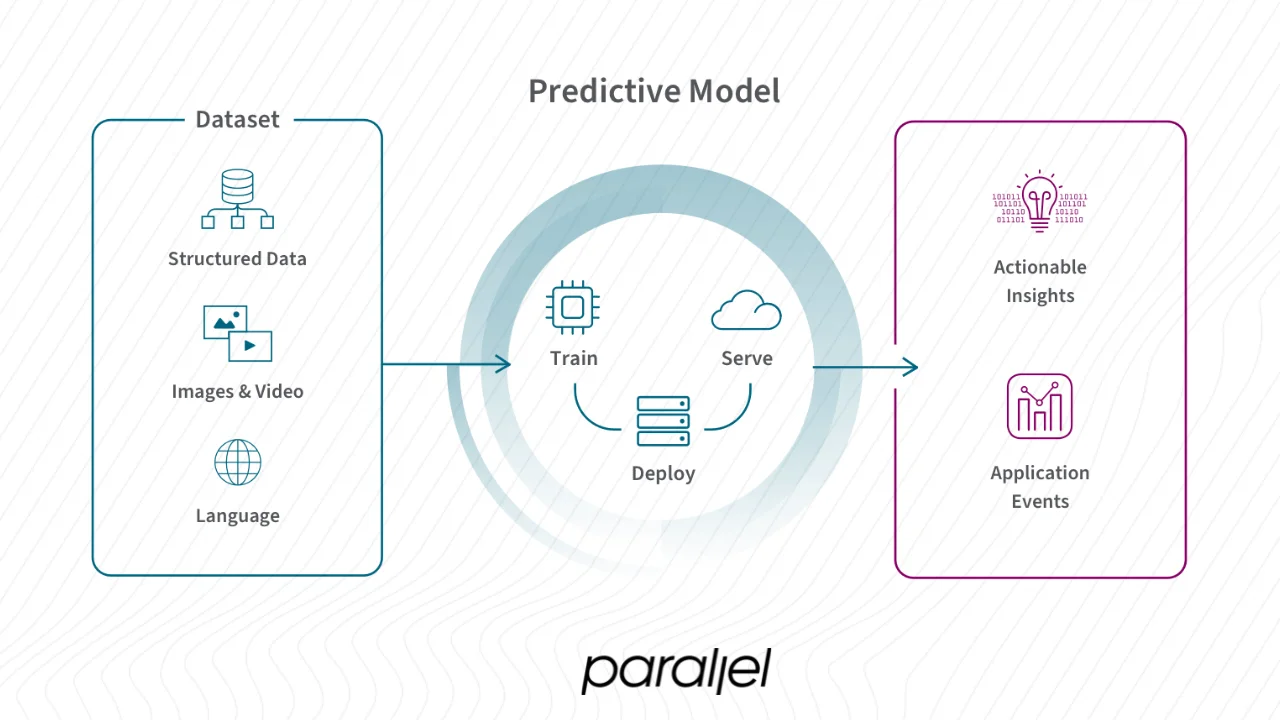
Several terms underpin this approach. Behaviour prediction models use algorithms such as decision trees or neural networks to estimate the likelihood of an action (like conversion or churn) from past patterns. Adaptive interfaces change what users see or how they proceed based on those forecasts — for instance, skipping intermediate onboarding steps if a user is familiar with a feature. Personalised user experience refers to tailoring content or navigation to individuals or micro‑segments. Clickstream data analysis captures navigation paths and interactions, which feed back into those models. Together, these concepts allow teams to move from observation to anticipation.
Why early‑stage teams should care
For early‑stage founders and product leaders, every interaction counts. Missed conversions, confusing flows or slow feedback loops can make the difference between product‑market fit and running out of runway. This approach offers several advantages.
- Personalisation at scale. Data‑driven predictions let you customise experiences for each visitor or segment. The Osedea team describes predictive UX as tapping into data to craft proactive interactions that anticipate needs before users realise them. When a system adjusts content or steps automatically, people feel understood, which leads to higher engagement.
- Less friction, fewer drop‑offs. By forecasting where people struggle, you can shorten flows or provide help at the right moment. UXPin’s research lists “fewer friction points” as one of the main benefits of predictive methods. Instead of fixing issues after users complain, you reduce the likelihood of those issues in the first place.
- Faster iterations. In the same article, UXPin notes that predictive analytics cuts feedback cycles from days to hours. Mark Figueiredo, a senior UX lead at T. Rowe Price, explains that what used to take days to gather feedback now takes hours — by reducing back‑and‑forth and manual redlining, predictive tools shaved months off timelines. For a small team, shaving weeks from design–development cycles means more experiments and faster learning.
- Higher engagement and conversion. Adaptive experiences keep people engaged. The Lyssna trends report quotes a design leader who notes that interfaces now change before users’ eyes, with predictive analytics matching suggestions to individual preferences. Another contributor observed that real‑time data‑powered micro‑interactions boosted engagement by 35 per cent and reduced bounce rates by 28 per cent. For startups chasing retention and revenue, these lifts translate into real impact.
- A strategic advantage. Over 80 per cent of companies will be using artificial‑intelligence‑powered analytics to optimise UX by 2025. Early adopters get a head start while competitors are still stuck in reactive cycles. For a bootstrapped team, focusing development efforts on predictive improvements rather than endless manual testing can be a differentiator.
Startups also face unique constraints: small budgets, limited research bandwidth and pressure to grow quickly. These techniques help prioritise the most promising flows by showing which friction points matter and which user segments need attention. Instead of redesigning the entire product, you can focus on the paths with the highest predicted drop‑off, saving money and time. As we’ve seen working with artificial‑intelligence‑enabled SaaS teams, early predictive insights often reveal that perceived “missing features” aren’t the real issue — the problem is a confusing onboarding path or an overloaded dashboard. Fixing those friction points first is usually cheaper than adding new functionality.
Foundations: data, models and mapping
Designing with foresight requires three ingredients: the right data, appropriate models and a clear understanding of the user’s path. Let’s unpack each.
Data and signals
Predictive models are only as good as the data that feed them. Behavioural signals such as page views, clicks, hovers, scroll depth, session duration and navigation paths (clickstream data) provide rich context. These differ from demographic data (age, location) or psychographic data (interests, attitudes). For UX purposes, behavioural signals typically matter more because they reveal intent. Segmentation strategies are crucial: dividing users into cohorts based on common traits (for example, new vs. returning visitors, free vs. paid users) allows models to be calibrated for each group. Funnel analysis — mapping how users progress from onboarding through activation and retention — identifies where people drop off and where predictions could help. For example, if data show that 40 per cent of new mobile users abandon at the fifth step of onboarding, you can build a model that flags high‑risk users at step four and surfaces help or a shortcut.
Models and algorithms
Several classes of models are useful in this context:
- Regression models forecast continuous outcomes, such as how many minutes a user will spend in an app or the average order value. They’re useful when you need to estimate a numeric variable.
- Classification models predict categorical outcomes, such as whether someone will convert, churn or upgrade. Logistic regression, decision trees and random forests fall into this category.
- Time‑series forecasting predicts how a metric will change over time — for example, projecting weekly active users based on seasonality.
These models fall under the umbrella of machine learning, which uses mathematical functions and heuristics to learn from data. Decision trees and gradient‑boosting machines can uncover complex interactions; neural networks may capture non‑linear patterns if you have enough data. Simpler models are often sufficient for early‑stage teams. What matters is that the output is interpretable and timely so that designers can act on it.
Adaptive and personalisation algorithms sit on top of these models. They compare a user’s current behaviour to similar patterns in the training data and suggest the next best action. For example, Osedea notes that predictive UX uses classifiers and decision trees to analyse past behaviour and deliver personalised suggestions. Such algorithms underpin product suggestion engines, changing onboarding steps and content ranking.
Mapping the experience and metrics
Once you have data and models, the next step is to map the user’s path. Customer‑path mapping often covers stages like discovery, onboarding, activation, retention and expansion. With predictive analytics for UX, you overlay likely drop‑offs or opportunities onto that map. If the model predicts that a user is unlikely to complete onboarding, the interface can adapt by simplifying tasks or offering guidance. For returning users, predictive models might trigger a quick‑access shortcut to frequently used features. Experience optimization requires tracking metrics such as session frequency, length, interaction depth, drop‑off rates and conversion rates. You also need to measure how different segments respond to interventions; segment performance metrics help refine models.
Continuous feedback loops are essential. Every prediction generates an outcome, and comparing actual outcomes to predicted ones refines the model. Trend forecasting — spotting seasonal or cohort‑based changes in behaviour — keeps the models current. According to Accelerant Research, advanced analytics platforms now incorporate real‑time artificial‑intelligence‑driven insights, allowing teams to identify patterns and anomalies as they appear.
Applying predictive analytics in early‑stage products
You have the data and the models; now what? Implementing predictive methods requires coordination across product, design and data teams. Here’s a practical roadmap we’ve used with clients.
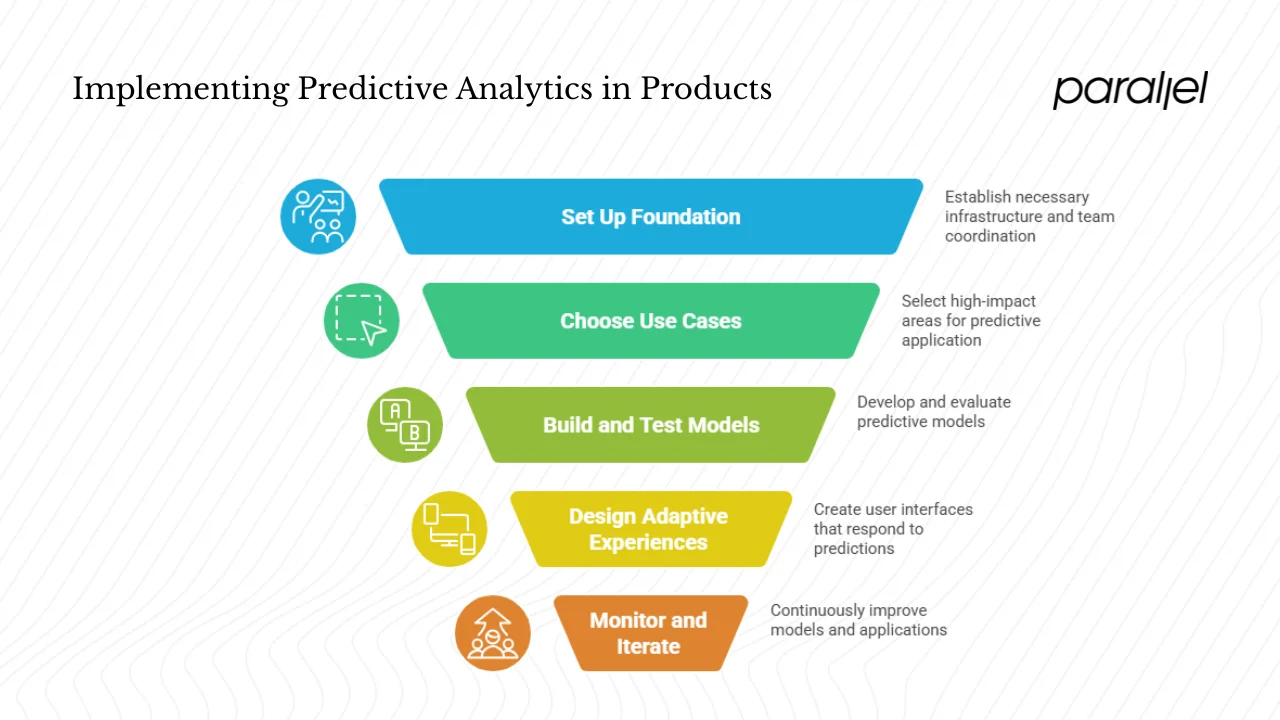
1) Set up the foundation
- Instrument your product. Ensure you are collecting meaningful behavioural events: page visits, clicks, swipes, input submissions, drop‑offs. Tools like Segment, PostHog or Amplitude can capture these events out of the box. Avoid the temptation to track everything — focus on events tied to your essential business objectives.
- Coordinate your team. Data scientists, designers and product managers need to collaborate. A common pitfall is building models that never reach the interface because designers weren’t part of the process. Shared dashboards and weekly check‑ins help bridge this gap.
- Define clear objectives. Identify the outcome you care about: “reduce onboarding drop‑off by 20 per cent,” “increase activation by 30 per cent,” or “boost repeat usage.” Objectives tie the predictive work to business goals.
2) Choose the right use‑cases
You don’t need predictive analytics everywhere. Startups should pick narrow, high‑impact flows:
- Onboarding assistance. Predict when a new user is likely to abandon and trigger a hint, skip option or chat support. In a healthcare example, Osedea suggests predicting when someone is about to run out of supplements and sending a reminder — the same logic applies to SaaS: remind the user of unfinished setup just before they drop off.
- Personalisation. Adjust menus, suggestions or dashboard widgets based on predicted interest. For example, show advanced features to power users while keeping the interface simple for beginners.
- Funnel improvement. Use funnel analysis to find steps with high churn. Build a model to predict churn at those steps and redesign the flow or surface alternatives.
- Adaptive interfaces. If the model recognises a user as a returning visitor, it might skip the welcome tour. Emotionally aware systems can even modify colours or messaging based on inferred mood.
- Segment‑based experiments. Test different flows for different cohorts. Predictive models can identify which segment responds best to which version, allowing you to iterate quickly.
3) Build and test your models
- Start simple. For classification tasks (for example, “Will this user finish onboarding?”), logistic regression or decision trees are effective and interpretable. For regression tasks (“How long will someone spend in the app?”), linear models often suffice. Use cross‑validation to avoid overfitting.
- Integrate with the interface. Once predictions are ready, connect them to the front end. If your model scores a user as high risk for churn, the product should automatically adjust the flow.
- A/B test interventions. Compare the predictive‑driven flow against your baseline. Measure conversion, engagement, satisfaction and retention. UXPin’s experience demonstrates that predictive approaches can reduce feedback cycles dramatically.
- Refine with feedback. Monitor where the model mispredicts; update the training data and adjust features. This iterative loop is the heart of data‑informed design.
4) Design adaptive experiences
Adaptive interfaces are not magic: they require thoughtful design. Here are principles we follow:
- Contextual adaptation. Don’t randomly change elements; base adjustments on clear signals. If a user repeatedly uses a filter, surface it earlier.
- Explain changes when appropriate. If you skip steps or pre‑fill data, provide a short explanation so users trust the system.
- Respect privacy and consent. Osedea emphasises that designers must be transparent about data collection and give users control over predictive features. Similarly, UXPin lists transparent data collection, user consent management, data minimisation and secure storage as critical practices. Always comply with local regulations like GDPR or CCPA and let users opt out of personalised experiences.
5) Monitor, iterate and scale
Once predictive UX is live, continuously monitor essential metrics: engagement, conversion, drop‑off and satisfaction. Compare predicted outcomes to actual results to evaluate model accuracy. Over time, shift from small experiments to broader applications: after fixing onboarding, tackle retention flows, upsell paths or mobile‑specific interactions. Accelerant Research notes that predictive analytics helps teams anticipate user behaviour before it happens and integrate these insights into research workflows. As your product grows, invest in more sophisticated models (such as recurrent neural networks for time‑series data) and infrastructure for real‑time predictions.
Risks and best practices
While predictive analytics in UX design is powerful, it’s not a magic bullet. Here are some pitfalls and how to avoid them.
- Poor data quality. Garbage in, garbage out. If events are mislabeled or missing, predictions will mislead. Regularly audit your instrumentation.
- Over‑reliance on predictions. Models are probabilistic and can be wrong. Use predictions as guidance, not gospel. Keep manual testing and qualitative research in your toolkit.
- Privacy and ethics. Predictive UX collects and uses behaviour data. This raises concerns about surveillance and manipulation. The Lyssna article notes growing worries about data privacy and calls for transparency, granular controls and data minimisation. Make sure your practices are ethical and respectful.
- Bias and fairness. Models trained on skewed data can perpetuate inequities. Regularly perform bias audits and use synthetic data to represent under‑served groups.
- Cultural fit. Predictive UX requires close collaboration between designers, product managers and data scientists. Without shared understanding, models may be built that designers can’t implement, or designs may be created that predictions don’t support.
- Start small. Trying to “predict everything” at once often fails. Focus on one or two flows with clear metrics, build confidence and then expand.
- Tie to business outcomes. The point of predictive analytics in UX design is to improve real metrics. The Forrester study commissioned by Acoustic found that companies using predictive UX enjoyed higher engagement, increased loyalty, improved efficiency, boosted revenue and stronger brand identity. Connect your interventions to revenue or retention to justify ongoing investment.
Examples and patterns
A few scenarios illustrate how predictive analytics in UX design works in practice.
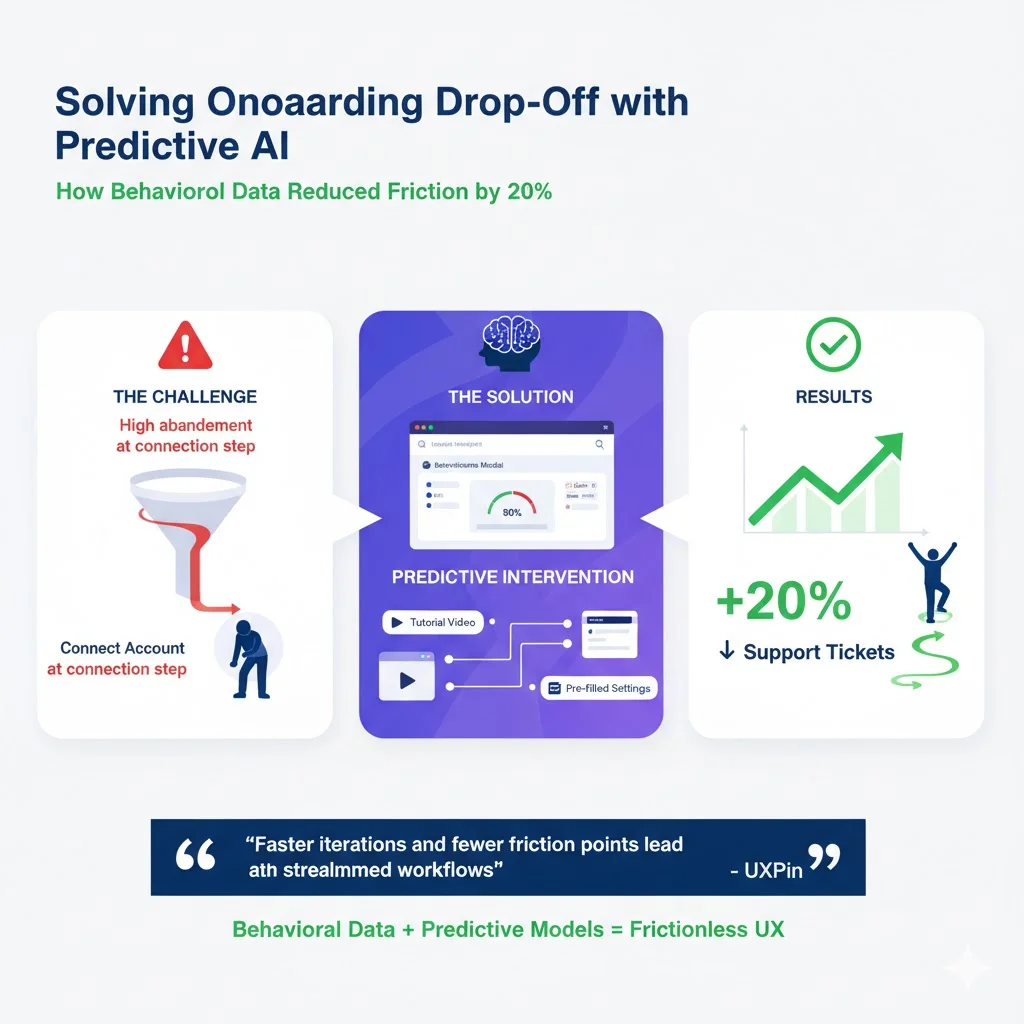
1) Reducing onboarding drop‑off: A SaaS company noticed that many users abandoned the “connect your account” step. By analysing behavioural data, the team built a classification model predicting who would drop off. If the probability was high, the interface offered a short video or pre‑filled settings. After launch, onboarding completion improved by 20 per cent, and support tickets dropped substantially. A quote from UXPin captures the impact of such improvements: faster iterations and fewer friction points lead to streamlined workflows.
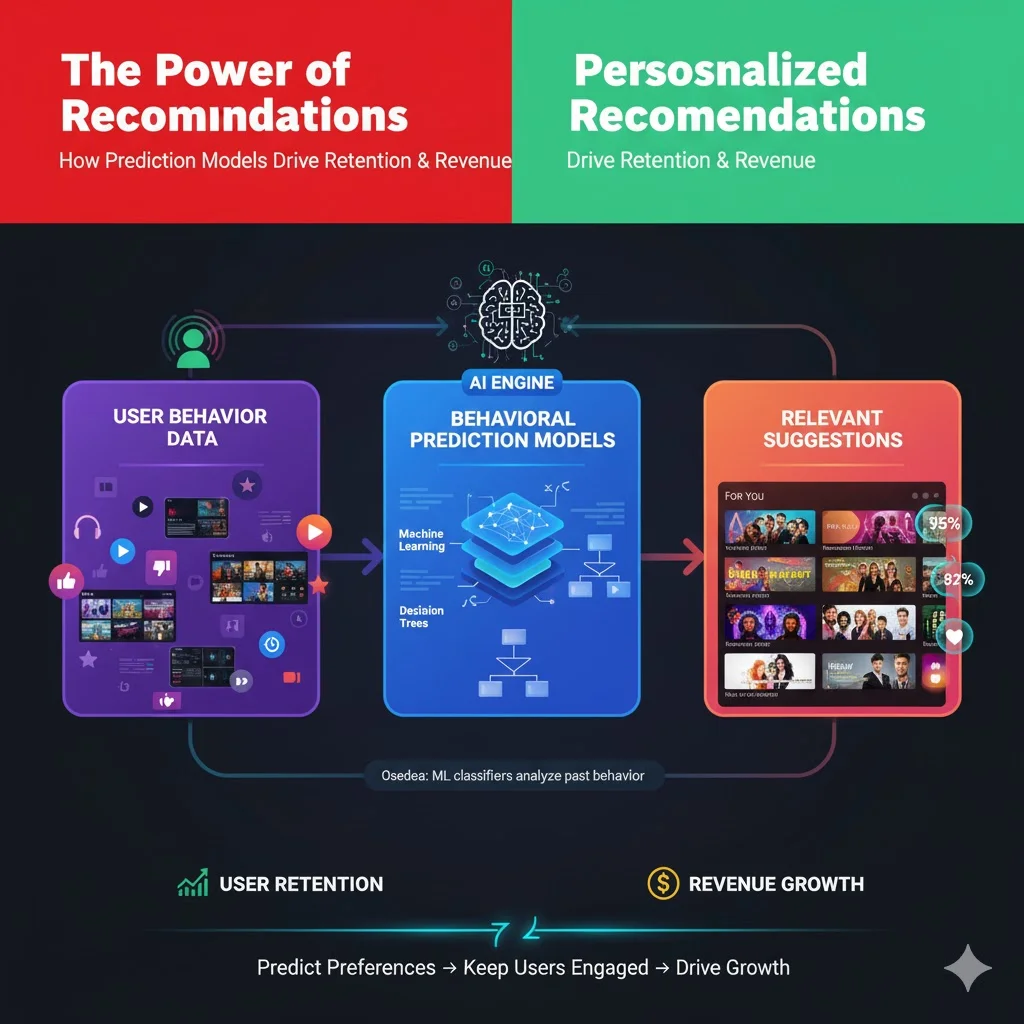
2) Personalised suggestions: Streaming services like Netflix and Spotify use behaviour‑prediction models to suggest content. Osedea notes that machine‑learning classifiers and decision trees analyse past behaviour to suggest relevant products. By predicting what someone might enjoy, these platforms keep users watching and listening, which increases retention and revenue.
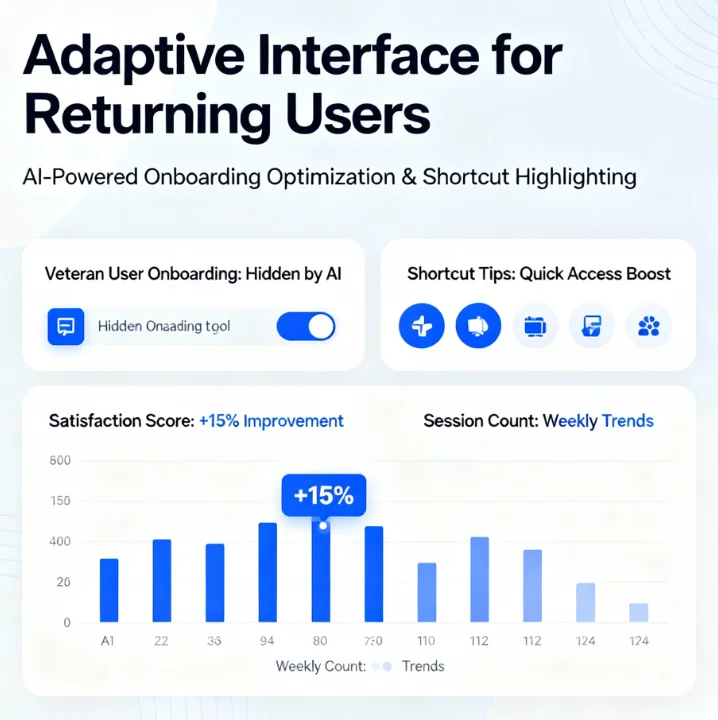
3) Adaptive interfaces for returning users: A productivity app noticed that experienced users were frustrated by the same onboarding checklist that new users needed. By predicting whether someone was a first‑time or returning user based on session count and past actions, the app hid unnecessary instructions for veterans and offered shortcuts to frequently used features. Engagement increased, and user satisfaction scores improved.
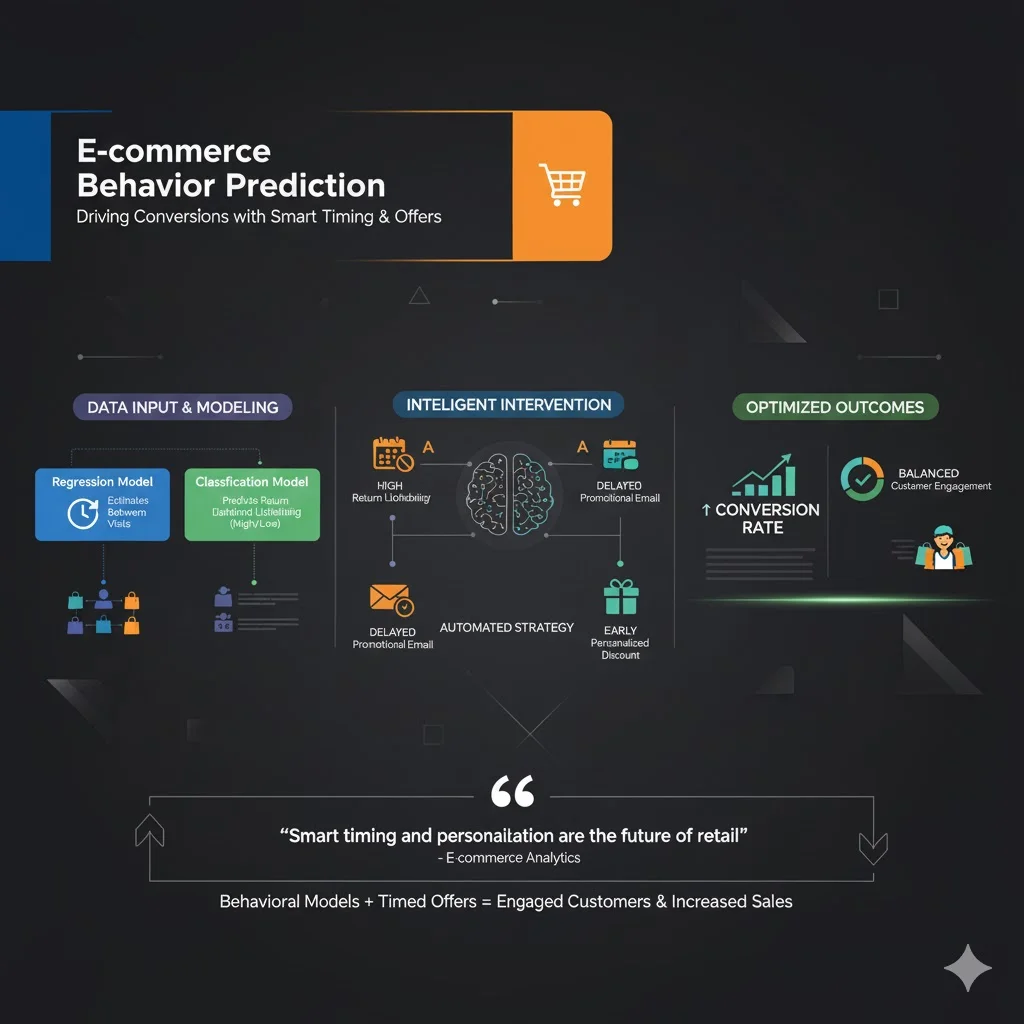
4) Behaviour prediction in e‑commerce: In our work with a commerce startup, we used regression models to estimate the time between visits and classification models to predict whether a shopper would return. When the model indicated a high likelihood of return, we delayed promotional emails, respecting the shopper’s cadence. When the model predicted low return probability, we sent a personalised discount earlier. This balance improved conversion rates without overwhelming loyal customers.
Looking ahead
The next few years will bring even richer predictive UX capabilities. Accelerant Research predicts that artificial intelligence and machine learning are transforming UX research methods, with automated sentiment analysis parsing thousands of feedback comments. Hyper‑personalisation will move from static segments to real‑time context awareness, enabled by techniques like federated learning. Multimodal data from wearables, biometrics and eye‑tracking will feed models that detect frustration or delight and adapt interfaces accordingly. Designers will need to consider ethical impacts, energy consumption and representing various groups as these technologies mature. Synthetic data will help address bias, and decentralised research ecosystems may democratise access to insights. For now, early‑stage teams can get a head start by instrumenting their products, building simple models and designing experiences that flex with the user’s needs.
Final thoughts
Predictive analytics in UX design is more than a buzzword; it’s a way of working that shifts teams from reacting to anticipating. By using behavioural data and machine‑learning models, products adapt in real time, leading to faster iterations, fewer friction points and higher engagement. The benefits are backed by research — UXPin shows that predictive methods reduce design cycles and enhance personalisation, while a Forrester study reports improved engagement, efficiency and revenue. For founders and product leaders, the message is clear: start small, pick a high‑impact flow, collaborate closely across design and data, respect user privacy and iterate. Teams that anticipate user needs will build products that people love and that businesses rely on.
FAQ
1) What is predictive UX?
Predictive UX refers to designing experiences that anticipate what users will do next. Instead of reacting to clicks or surveys, teams use behavioural data and machine‑learning models to forecast upcoming actions and adjust the interface. This approach creates personalised interactions and addresses pain points before they arise.
2) What are examples of predictive analytics?
Examples include product suggestions based on browsing and purchase history; onboarding flows that trigger help when the model predicts a user will abandon; adaptive dashboards that rearrange widgets based on predicted interest; and churn prediction that prompts timely interventions. An e‑commerce shop might predict when a customer will run out of a consumable and send a reorder reminder.
3) What are the three types of predictive analytics?
The three main types are regression (predicting numeric outcomes like time spent or order value), classification (predicting categories like conversion vs. churn) and time‑series forecasting (predicting values over time, such as weekly active users). Clustering and segmentation are related techniques but are typically used for grouping rather than forecasting.
4) What is UX analytics?
UX analytics is the practice of analysing how users interact with a product. It combines quantitative data (clicks, swipes, session length, drop‑offs) and qualitative insights (interviews, surveys) to understand where people struggle or succeed. UX analytics is primarily descriptive and diagnostic.
5) How is predictive analytics different from UX analytics?
UX analytics tells you what happened — how many people clicked, where they got stuck and why. Predictive analytics builds on that by forecasting what will happen next using statistical and machine‑learning models. It lets you adapt the design proactively rather than only fixing issues afterwards.
6) How do I get started with predictive analytics in UX for a startup?
Start by tracking important behavioural events and defining a specific goal, such as reducing onboarding drop‑off. Segment your users and perform funnel analysis to identify high‑impact areas. Build a simple classification or regression model using historical data. Integrate the model’s predictions into the interface (for example, show a shorter flow for users flagged as high risk) and run A/B tests to compare results. Finally, iterate based on feedback and scale to other parts of the product.

check out these related blogs


.webp)


.avif)