A major retailer once lost buyers because it forced them to create an account. Changing a button from “Register” to “Continue” allowed guest checkout and generated about $300 million in extra sales. This story shows that investing in user experience—the ROI of UX—can shape a company’s future. After years helping early‑stage teams, I’ve learned that good design isn’t just about visuals; it’s about solving the right problems. This guide will show you how to think about returns from better experiences, choose metrics that matter and build a business case that wins support.
What is the ROI of UX?
Many companies see returns ranging from $2 to $100 for every $1 invested in UX. The ROI of UX comes down to this: when a product is easy to use, people stay longer, convert more often, and are more likely to return. Good user experience reduces friction, which means fewer drop-offs, higher sales, lower support costs, and less wasted development time fixing avoidable issues.
Why UX ROI matters for startups
When you run an early‑stage business, design may seem like a “nice to have.” It’s tempting to focus on features and technical milestones while postponing usability improvements. But research shows that user experience is deeply linked to outcomes that matter to founders: conversion, retention and brand perception.

1) Direct links to revenue and growth
Forrester’s famous study found that every dollar invested in UX returns up to $100, which translates to nearly a 9,900% return. Well‑designed interfaces can boost conversion rates by up to 200%, and a better end‑to‑end experience can lift conversions by 400%. Data from McKinsey’s design‑forward companies supports this: organisations that scored in the top quartile of their design index achieved 32 percentage points higher revenue growth and 56 percentage points higher total return to shareholders over five years than their industry peers. When you’re fighting for early customers, even small improvements in sign‑ups or purchases can change your runway.
2) The cost of ignoring UX
Poor experiences drive people away. Studies show that 88% of users are less likely to return after a bad interaction, and 32% of customers will stop doing business with a brand they love after one negative experience. Lost trust spreads quickly through word of mouth and social media. Apart from lost revenue, ignoring UX increases support costs, tech debt and rework. Fixing issues late in the development cycle is ten times more expensive than addressing them early—a principle often called the 1–10–100 rule. When you invest in research and usability testing at the start, you reduce support tickets, avoid redesigns and prevent reputational damage.
3) Connecting UX with business objectives
User experience isn’t a charitable expense; it’s a strategic lever. A smoother onboarding flow improves activation and reduces churn. Clear microcopy increases checkouts and lowers cart abandonment. Faster workflows for internal tools reduce training costs and raise employee productivity. In other words, improvements in experience translate directly into business value: market competitiveness, brand loyalty and customer retention. According to Maze’s 2025 statistics, companies that invest in research and data‑driven processes are 1.9 times more likely to report improved customer satisfaction.
Risk mitigation is another reason to care. Usability problems spotted early avoid expensive fixes later. You also guard against legal risks: over 1.3 billion people live with some kind of disability, yet 90% of websites are inaccessible. Accessible and welcoming design helps you reach a larger audience and keeps you ahead of future accessibility regulations.
Understanding ROI in the UX context
At its core, ROI is a simple ratio: (gains minus cost) divided by cost. In the context of design, gains come in many types:
- Revenue uplift: higher conversion rates, bigger average order values or more up‑selling
- Cost avoidance: fewer support tickets, reduced error fixes and lower churn
- Efficiency gains: shorter task times for internal tools, fewer steps in workflows, automation
- Retention and loyalty: lower churn rates, higher customer lifetime value and improved NPS/CSAT
- Intangible benefits: stronger brand sentiment, positive reviews and referrals, happier teams
Costs include research, design salaries, testing tools, implementation and ongoing maintenance. They also include opportunity costs: time your engineers spend building improved interfaces instead of other features. When calculating this metric, you compare the uplift you expect (or realise) against the total investment over a given timeframe.
Challenges and caveats
Attributing gains solely to user experience is tricky. Marketing campaigns, pricing changes and external events all influence metrics. That’s why ROI calculations should be approached as estimates. Nielsen Norman Group warns against three common myths: believing that ROI calculations are purely about money, insisting on perfect precision and thinking you must account for every detailnngroup.com. In practice, it’s more important to show that improvements contribute meaningfully to business goals than to produce a figure down to the last cent.
Estimation errors are inevitable. Uncertainty is highest when predicting intangible benefits like brand perception. To handle this, run sensitivity analyses—best, worst and realistic scenarios—to understand the range of outcomes. Finally, don’t neglect qualitative ROI. Improved sentiment, word‑of‑mouth and team morale may not show up in spreadsheets immediately, but they contribute to long‑term health. Combining quantitative data with stories from users makes your case stronger.
Metrics and KPIs to measure UX ROI
You can’t manage what you don’t measure. When you need to demonstrate the ROI of UX, the metrics you choose should mirror your business model, so resist the urge to track everything. Common measures fall into four buckets:
Revenue and conversion: track how many visitors convert to paying customers, what they spend on average and where they drop out in a funnel. In the $300 million button case, simply renaming a button increased sales by 45%—a reminder that microcopy can have outsized effects.
Efficiency and cost avoidance: monitor task completion rates, time on task, support tickets and error reports. Fewer clicks and clearer workflows mean happier users and lower support costs.
Retention and engagement: watch churn, repeat visits, session length and adoption of essential features. Maze’s research indicates that improving the experience can increase retention by 42%, while a poor interaction pushes 88% of people away.
Sentiment and perception: look at NPS, satisfaction surveys, reviews and social mentions. Positive sentiment leads to organic referrals and brand loyalty that rarely show up in short‑term revenue but matter in the long run.
Internal measures such as prototype‑to‑launch cycle time and design debt can also reveal whether your process is healthy. A shared design system speeds up releases and reduces rework, saving both time and money.
A step‑by‑step framework to work out the ROI of UX
This framework shows how to work out the ROI of UX in a clear way. Follow these stages to link user problems with business outcomes.
Having the right metrics is only half the battle. You also need a process to translate them into a convincing ROI statement. The following five‑step framework, inspired by industry best practices and my own work, helps you do just that.
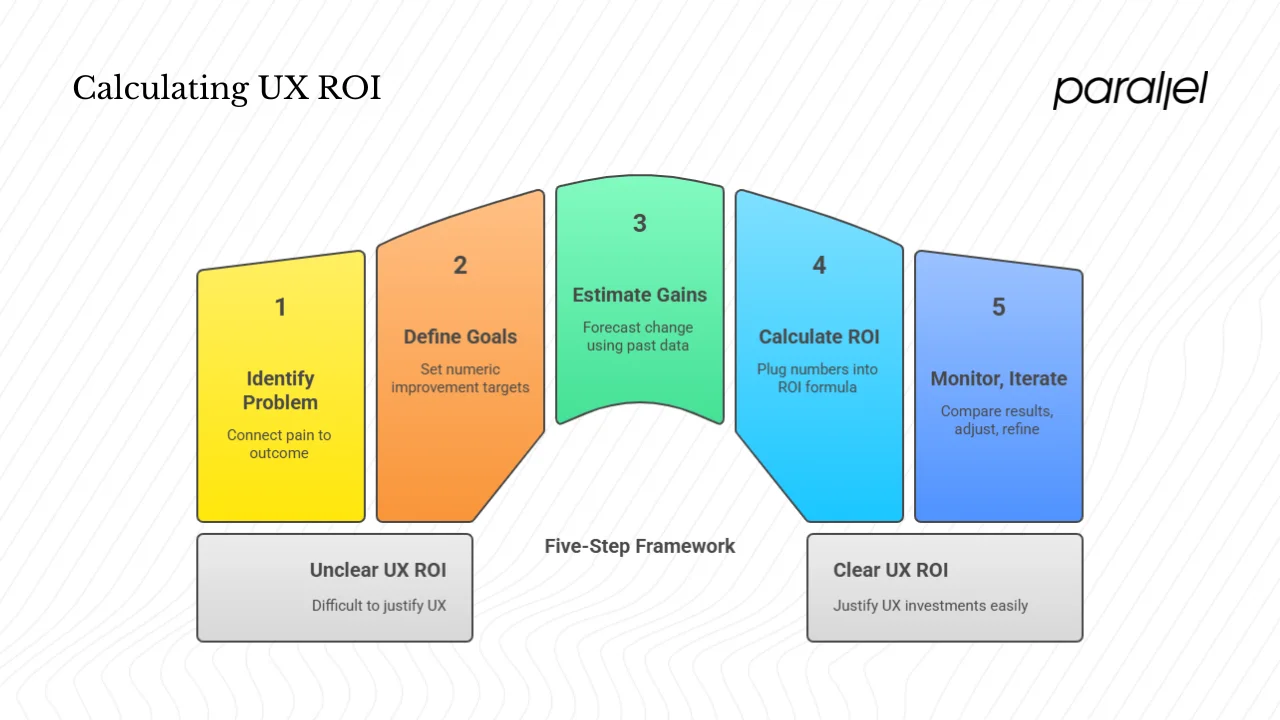
1. Identify the problem and set a baseline
Focus on a user's pain that connects to a business outcome. Maybe your checkout converts three per cent of visitors or your onboarding takes too long. Measure the current state—conversion rates, support volume, churn—so you know where you’re starting.
2. Define goals and expected improvements
Turn that problem into a target. Do you want to raise conversion to three and a half per cent or cut time to complete a task by 30%? Set numeric goals so you can tell whether the work paid off.
3. Estimate gains and costs
Forecast what your change will deliver using past experiments or a small pilot. For a checkout tweak, estimate extra orders from a half‑point lift in conversion and multiply by average order value. Total up the cost of research, design, development and testing.
4. Work out ROI and run scenarios
Plug the numbers into ROI = (gains – cost) / cost. Run best, realistic and worst‑case scenarios to see the range of outcomes. Work out how long it will take for gains to cover the investment. Short payback periods make a strong case.
5. Monitor, iterate and refine
Post‑launch, compare actual results with your baseline. If you didn’t hit your goal, adjust and iterate. Use A/B tests to isolate which change moved the needle. Continuous measurement builds confidence and highlights new opportunities.
Practical strategies to maximise UX ROI
Doing the math is necessary, but your actions determine the size of returns. To maximise the ROI of UX, here are tactics I’ve found effective with founders building machine‑learning and SaaS products:
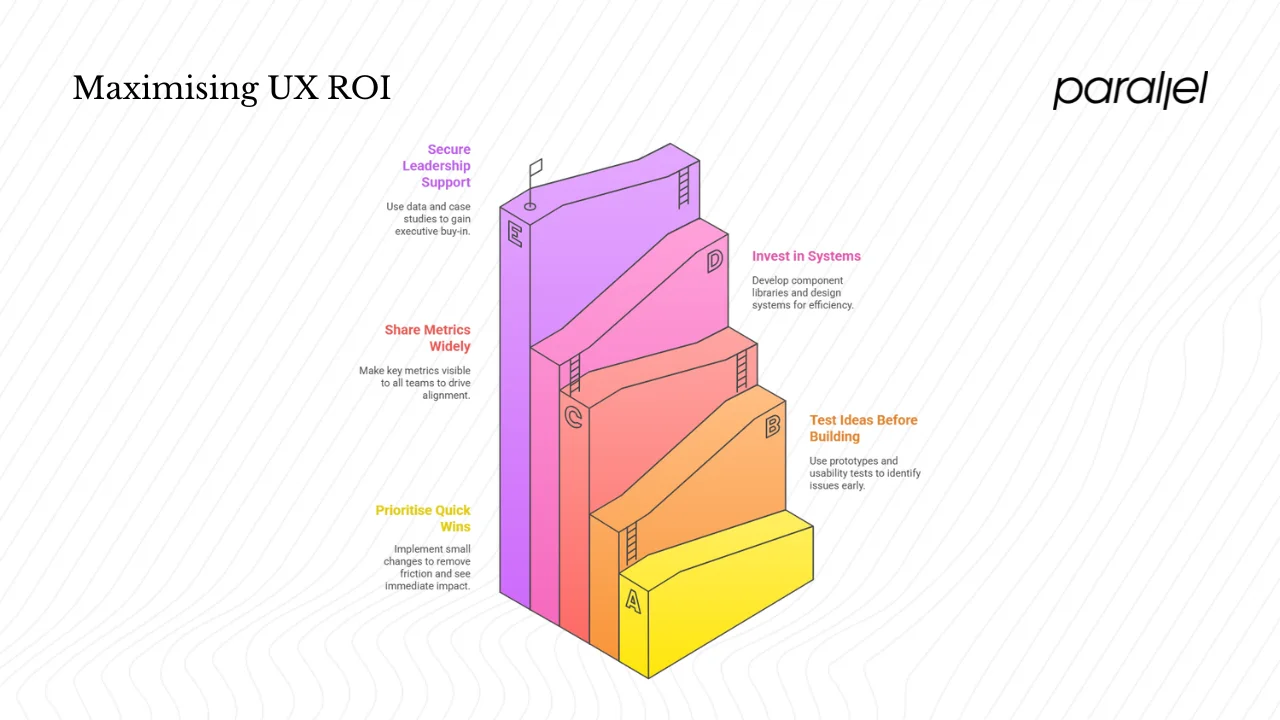
1) Prioritise quick wins
Start with small changes that remove glaring friction, such as clarifying error messages or reducing the number of fields in a sign‑up page. The $300 million button case shows how a simple copy tweak can have outsized impact.
2) Test ideas before building
Low‑fidelity prototypes and guerrilla usability tests reveal problems before you commit engineering time. Maze’s survey found that teams with mature research practices are 1.9× more likely to report better customer satisfaction.
3) Share metrics widely
Make conversion rates, churn and satisfaction scores visible across product, design and engineering. When everyone sees how their work affects revenue and retention, they rally behind improvements.
4) Invest in systems
A component library and design system reduce duplication and let teams move faster. Addressing design debt early saves costly fixes later.
5) Secure leadership support
Use case studies and credible data to persuade executives. Show before‑and‑after screens and connect improvements to revenue or cost savings. A champion at the top makes budgeting and cross‑team collaboration easier.
Case studies and examples
Real stories make the ROI of UX tangible. A retail giant replaced a “Register” button with “Continue,” making guest checkout possible and adding around $300 million in annual revenue while reducing abandonment. HubSpot simplified its record page and saw revenue rise by 33% year over year. SEOcrawl revamped its interface, doubling its user base and cutting support queries. These cases show how simple changes, holistic redesigns and process improvements can yield big returns.
In our own projects, we’ve helped early‑stage teams reorder dashboards around user questions, dropping churn by 20% and raising lifetime value. Redesigning an onboarding flow to show value sooner cut time‑to‑value by 70%, tripling weekly active users. Such outcomes demonstrate that thoughtful design decisions directly influence revenue and retention.
Common pitfalls and how to avoid them
Even seasoned teams slip into traps when discussing ROI. Avoid inflating projections—use conservative numbers rather than assuming you’ll achieve Forrester’s reported 9,900% return. Recognise that growth results from many factors, so isolate the impact of design by running A/B tests and rolling out changes gradually. Keep in mind that some gains, like trust from accessible and welcoming design, appear over months or years. Combine numbers with qualitative insights from interviews and surveys to capture the full picture. Keep updating your assumptions as markets and products change. And secure buy‑in early; without leadership support and ongoing measurement, even the best redesigns lose momentum.
How UX ROI evolves over time
Your stage of growth influences how you should think about returns from design. The payback on usability is not static: early fixes often yield dramatic improvements, while later investments focus on retention and differentiation. As your product matures, the compounding effect of dozens of small improvements can be greater than one big redesign.
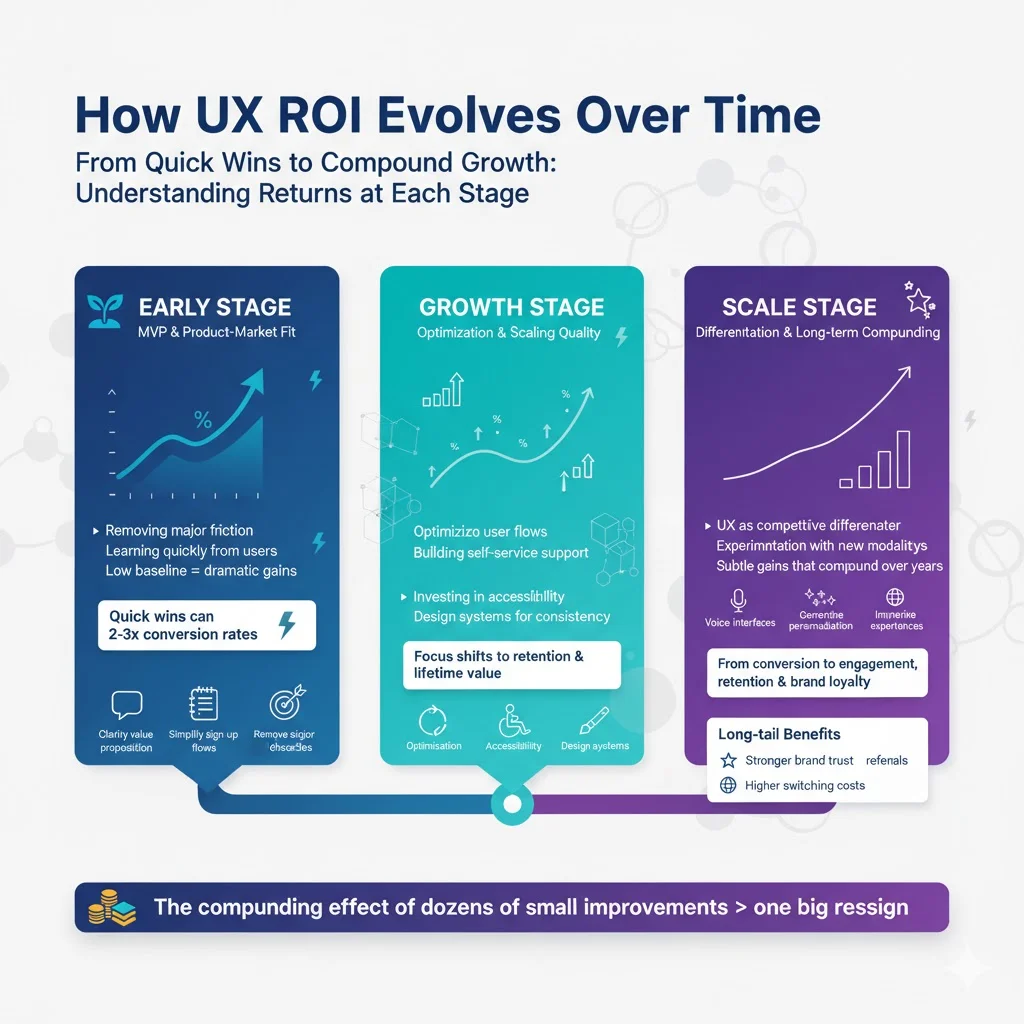
Early stage
At the MVP stage you’re still validating the product–market fit. Here, UX investment focuses on removing major friction and learning quickly. Gains may be dramatic because the baseline is low. Quick wins like clarifying your value proposition or simplifying sign‑up can double or triple conversion rates.
Growth stage
As your user base expands, you start optimising flows, building self‑service support and investing in accessibility. Returns may taper as the easy fixes are already done, but the impact on retention and lifetime value becomes significant. You also start investing in design systems to scale quality across multiple teams.
Scale stage
For mature companies, UX becomes a differentiator rather than a fix. You experiment with new modalities—voice interfaces, generative personalisation and immersive experiences. Gains at this stage can be subtle but accumulate over years through brand loyalty and reduced churn. You may shift from conversion metrics to focusing on engagement, retention and differentiation. Long‑tail benefits include stronger brand trust, organic referrals and higher switching costs for competitors.
Presenting and pitching UX ROI to stakeholders
Numbers don’t speak for themselves. To secure a budget and buy‑in, frame your ROI of the UX story thoughtfully. Leaders are more persuaded by a clear narrative than by spreadsheets alone, so weave metrics into a before‑and‑after story that shows the human impact of your design work.
Start with a narrative
Paint a “before and after” picture. Show a user struggling with your current product and contrast it with a smoother future state. Use metrics alongside screenshots or prototypes to make the story vivid. Emphasise the pain points in terms leadership understands: lost revenue, high churn and reputational risks.
Speak the language of business
Translate design improvements into revenue, cost savings or market share. If NPS increases by ten points and churn drops by two points, explain what that means for annual recurring revenue. Benchmarks like Forrester’s 100× return and McKinsey’s 32‑point revenue growth lend credibility.
Show the risk of not investing
Share statistics that emphasise the cost of inaction. 88% of users who experience bad UX will not return; 32% of customers leave after one negative experience. Show how these numbers translate to your revenue projections.
Use pilots and experiments
Run a small‑scale experiment or A/B test. If a simple copy change raises conversions by five per cent, it’s easier to ask for a larger budget for a broader redesign. Real data from your own product is more convincing than generic statistics.
Benchmark against industry studies
Reference credible research. Maze’s and McKinsey’s statistics show what’s possible. Case studies like the $300 million button demonstrate the outsized impact of thoughtful design.
Future trends and evolving considerations
Looking ahead, UX ROI will be influenced by technology and broader social trends. Voice‑based interactions are moving mainstream; researchers expect almost half of the United States to use voice assistants by 2026. Designing for conversation changes what you measure—success rates of voice commands, retention over time—and offers new opportunities to make interactions effortless.
Personalisation driven by machine learning customises content and suggestions to each user. This can boost engagement and conversion, but teams must balance relevance with privacy and avoid creating filter bubbles.
Accessibility is no longer optional. Features like high‑contrast text, adjustable fonts, keyboard navigation and screen reader support are table stakes. Given that over 1.3 billion people live with disabilities, design that welcomes people with different abilities not only expands your audience but also mitigates legal and reputational risk.
Immersive experiences using augmented or virtual reality open new frontiers in training and entertainment. Measuring their impact requires fresh metrics like immersion time and learning outcomes. Finally, ethical and sustainable design choices—respecting user autonomy and encouraging responsible behaviour—will differentiate brands in an increasingly conscious market.
Conclusion
Putting a number on the ROI of UX may seem daunting, but it’s both possible and essential. Think of it not as a precise forecast but as a structured way to argue for better experiences. Start with the big pain points, set baselines and define clear targets. Combine quantitative metrics with qualitative insight. Use simple experiments to prove that small changes deliver outsized returns. Keep in mind that design is not a cost centre; it’s a strategic investment that drives growth, reduces waste and builds trust.
As you finish reading, pick one area in your product that frustrates users—maybe a confusing signup or a missing error message—and run a mini ROI experiment. Even a small improvement could be the start of a transformation.
More than numbers
It’s tempting to reduce design to spreadsheets, yet some of the biggest returns show up in ways you can’t easily quantify. A respectful, accessible interface builds trust that lasts long after a transaction. Clear guidance reduces anxiety and makes users feel welcome. Internally, a mindset that prizes thoughtful design raises morale and attracts better talent. These effects don’t show up in monthly dashboards, but they underpin sustainable growth. When you champion experience as a responsibility shared by product, engineering and marketing, you create compounding benefits: fewer support calls, more word‑of‑mouth referrals and a stronger brand reputation. Viewed this way, investing in user experience isn’t just a calculation; it’s a statement about the kind of company you want to run.
FAQ
1) What is the ROI of UX?
It’s a measure of the returns generated by investing in user experience. You work it out by subtracting the cost of research, design, development and testing from the gains (revenue uplift, cost savings, higher retention) and dividing the result by the cost. In simple terms, it links user experience impact to business value increase.
2) Is UX a dead field?
Far from it. As competition grows and user expectations rise, making products useful, usable and meaningful becomes more important. Designers now work on algorithmic personalisation, ethics, accessibility and new interfaces. The core mission remains: create experiences that help people achieve their goals efficiently and pleasantly.
3) What is the 1–10–100 rule in UX?
This rule suggests that spending ₹1 to find and fix a problem during research saves ₹10 to fix it during development and ₹100 to fix it after release. It highlights that early investment in usability is far cheaper than correcting issues later.
4) What is Forrester’s ROI figure?
Forrester research often cited in UX circles claims that every $1 invested in user experience returns up to $100. While you shouldn’t take the figure as a universal truth, it signals that thoughtful design can produce extremely high returns.

check out these related blogs


.avif)


.webp)