As founders, product managers, and design leaders at young tech companies, we need ways to keep our intuition honest. Products evolve quickly and it’s easy to convince ourselves that people love what we build simply because we’re close to it. UX benchmarking gives us a structured way to check that assumption.
By comparing user‑experience metrics over time or against comparable products we can see whether a design change actually made the experience better or worse. Nielsen Norman Group defines UX benchmarking as using metrics to evaluate a product’s user experience and gauge its performance against a meaningful standard. In other words, we put numbers around the practice of “is this better?” and use those numbers to guide product decisions.
What Is UX Benchmarking?
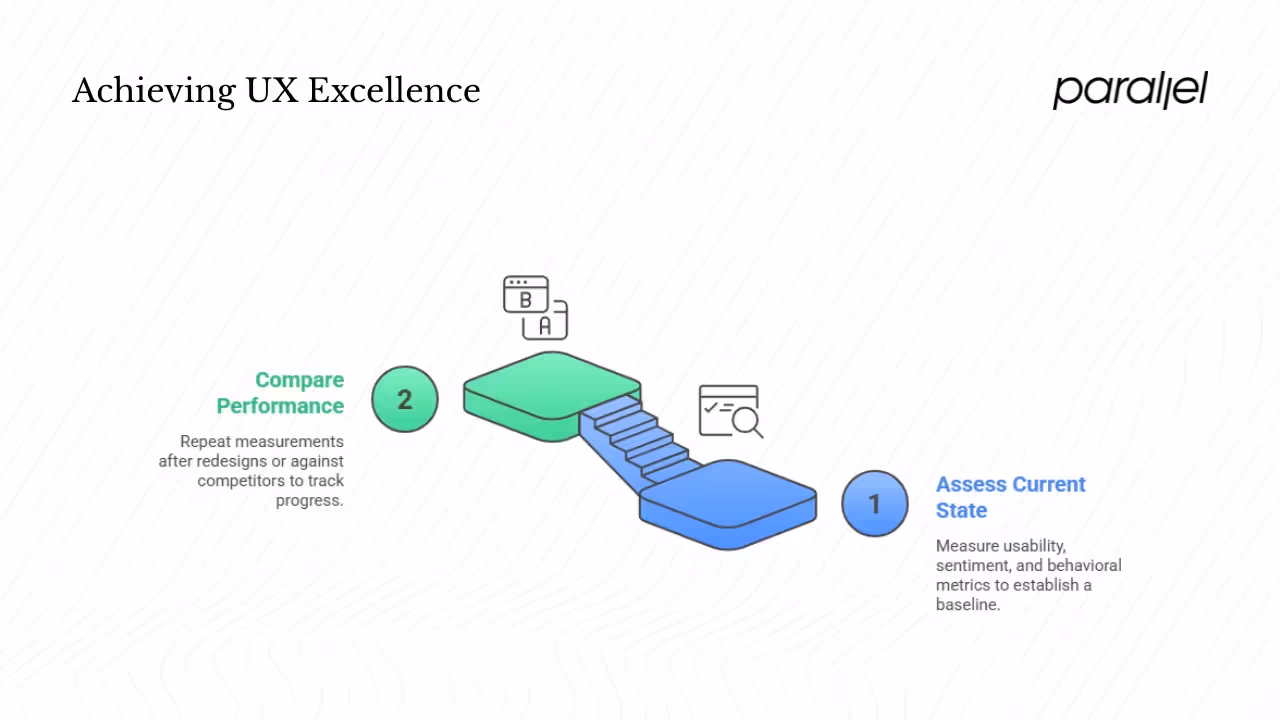
UX benchmarking is the process of evaluating a product’s user experience using metrics that allow comparison either across time or against another product. It serves two key purposes:
- Assess the current state: We measure usability metrics (e.g., success rate, time on task), sentiment metrics (e.g., satisfaction scores), and behavioural metrics (e.g., feature usage). This baseline tells us where the product stands today.
- Compare performance: We repeat the same measurements after a redesign or against competing products. Nielsen Norman Group notes that benchmarking often functions as an ongoing program rather than a one‑off activity; teams collect metrics across successive releases to keep track of progress.
Benchmarking links directly to user satisfaction and usability. For example, an average time to complete a purchase, number of clicks on a submit button and success rate for a task are quantitative indicators
When combined with post‑task satisfaction scores or Net Promoter Score (NPS) surveys, these numbers reveal how real users feel about the experience. By repeating the same tasks and surveys in subsequent versions, we can compare apples to apples. If satisfaction improves and errors drop, we have evidence that the redesign worked.
Why UX Benchmarking Matters for Startups & Product Leaders
Early‑stage teams often ship features in rapid cycles. We run usability tests, fix issues and push updates. Without a baseline, we don’t know if we’re truly improving or just changing. UX benchmarking fills that gap. It helps us:
- Know where we stand: A baseline allows us to see progress across versions, track the impact of design work and demonstrate the value of UX to stakeholders.
- Manage risk: In product‑market fit discussions, opinions can be loud. Quantitative metrics such as task success rate or ease‑of‑use ratings give a neutral reference. Baymard’s research shows that poor user experience leads to lost revenue; 32% of customers will abandon a brand after one bad experience and 88% of consumers are less likely to return after a bad experience. Benchmarking helps prevent these drop‑offs.
- Focus resources: Early-stage teams usually have small design and research budgets. Benchmarks highlight critical areas where improvement yields the most impact. For example, Baymard found that frictionless UX can raise conversion rates by up to 400%.
- Build confidence: When a feature goes live, metrics like task completion rates, time on task and satisfaction scores show whether the work paid off. We can share data rather than anecdotes when pitching future investments.
Core Concepts & Contextual Keywords
Benchmarking centres on a few core concepts:
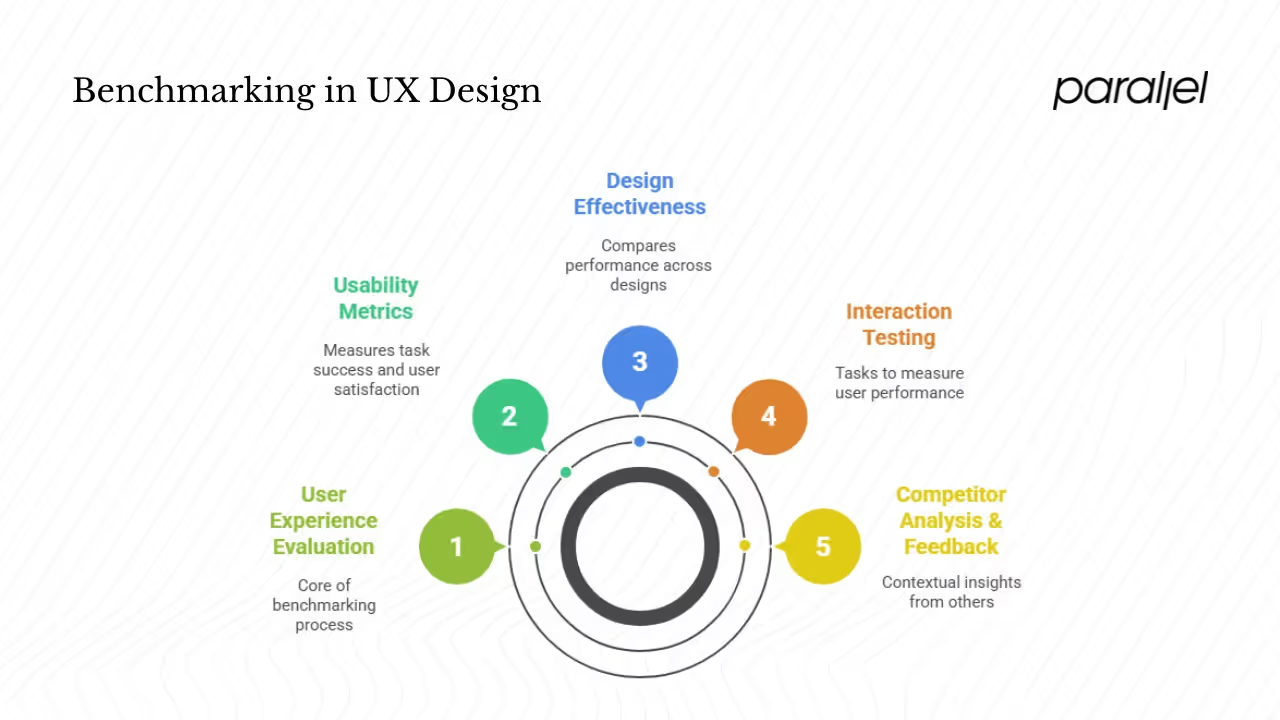
- User experience evaluation: Benchmarking structures the evaluation process. It ensures we look at objective measures rather than relying solely on intuition.
- Usability metrics: Common metrics include task success rate (percentage of users who complete a task without help), time on task, error count, and satisfaction rating. Nielsen Norman Group highlights these metrics in their adaptation of Google’s HEART framework. Each tells a different story: success rate reflects effectiveness, time on task shows efficiency, error count indicates ease, and satisfaction rating captures user attitude.
- Design effectiveness and performance indicators: Comparing the same metrics across releases (internal benchmarking) or against peers (competitive benchmarking) shows what works. For example, if a new checkout flow cuts time on task by 20% but satisfaction drops, we may have introduced other friction.
- Interaction testing: Structured tasks are central to benchmarking. We ask users to perform realistic tasks, measure their performance and then analyse differences across designs. Consistency in tasks is crucial.
- Competitor analysis and customer feedback: Benchmarking isn’t just about our own product. Comparing with competitors reveals whether our design stands out. Customer feedback (e.g., open‑ended survey responses) complements quantitative metrics by explaining why users struggle or succeed. In Reddit discussions, UX practitioners often combine heuristic reviews with competitor walkthroughs and real user quotes to learn from other products, stressing the importance of “watching, not copying” and focusing on solving the same problem better.
Sources & Methods for UX Benchmarking
Benchmarking relies on both quantitative and qualitative approaches:
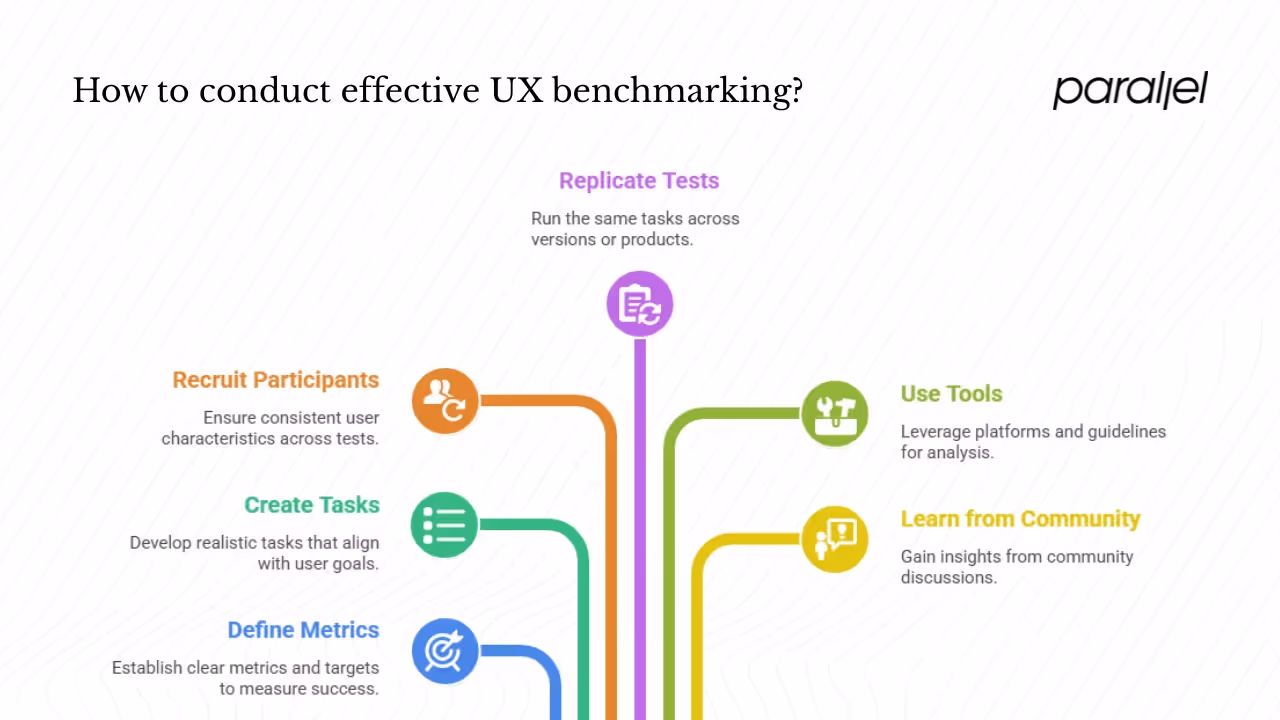
- Define metrics and targets: Decide which metrics matter (success rate, time on task, satisfaction, retention) and establish a target. For example, aim for an 80% success rate on a critical task.
- Create consistent tasks: Use realistic scenarios that mirror the most important tasks in your product. Nielsen Norman Group advises selecting 5–10 top tasks that align with user goals.
- Recruit similar participants: Keep user characteristics consistent across tests. If you benchmark version A with novice users and version B with experts, differences may reflect expertise rather than design.
- Replicate across versions or products: Run the same tasks with the same metrics in each version or competitor product. Keep everything else equal (device, environment, instructions) to isolate design differences.
- Use tools and guidelines: Baymard’s benchmarking platform assesses hundreds of e‑commerce sites across 240+ research‑based parameters and provides 2,300+ weighted performance scores. Tools like UXtweak and UserTesting offer templates for moderated and unmoderated tests, analytics dashboards and heatmaps. Guidelines from Nielsen Norman Group outline how to interpret metrics and calculate return on investment.
- Learn from community perspectives: Reddit threads on r/UXDesign and r/ProductManagement show that practitioners often start with simple metrics (time on task, success rate) and incrementally refine their approach. They stress iterative testing and recommend watching users interact with competitor products to uncover overlooked behaviours rather than blindly copying features. Many also emphasise that benchmarking is as much about learning user expectations as measuring numbers.
Step‑By‑Step Guide: 7 Steps to Benchmark UX
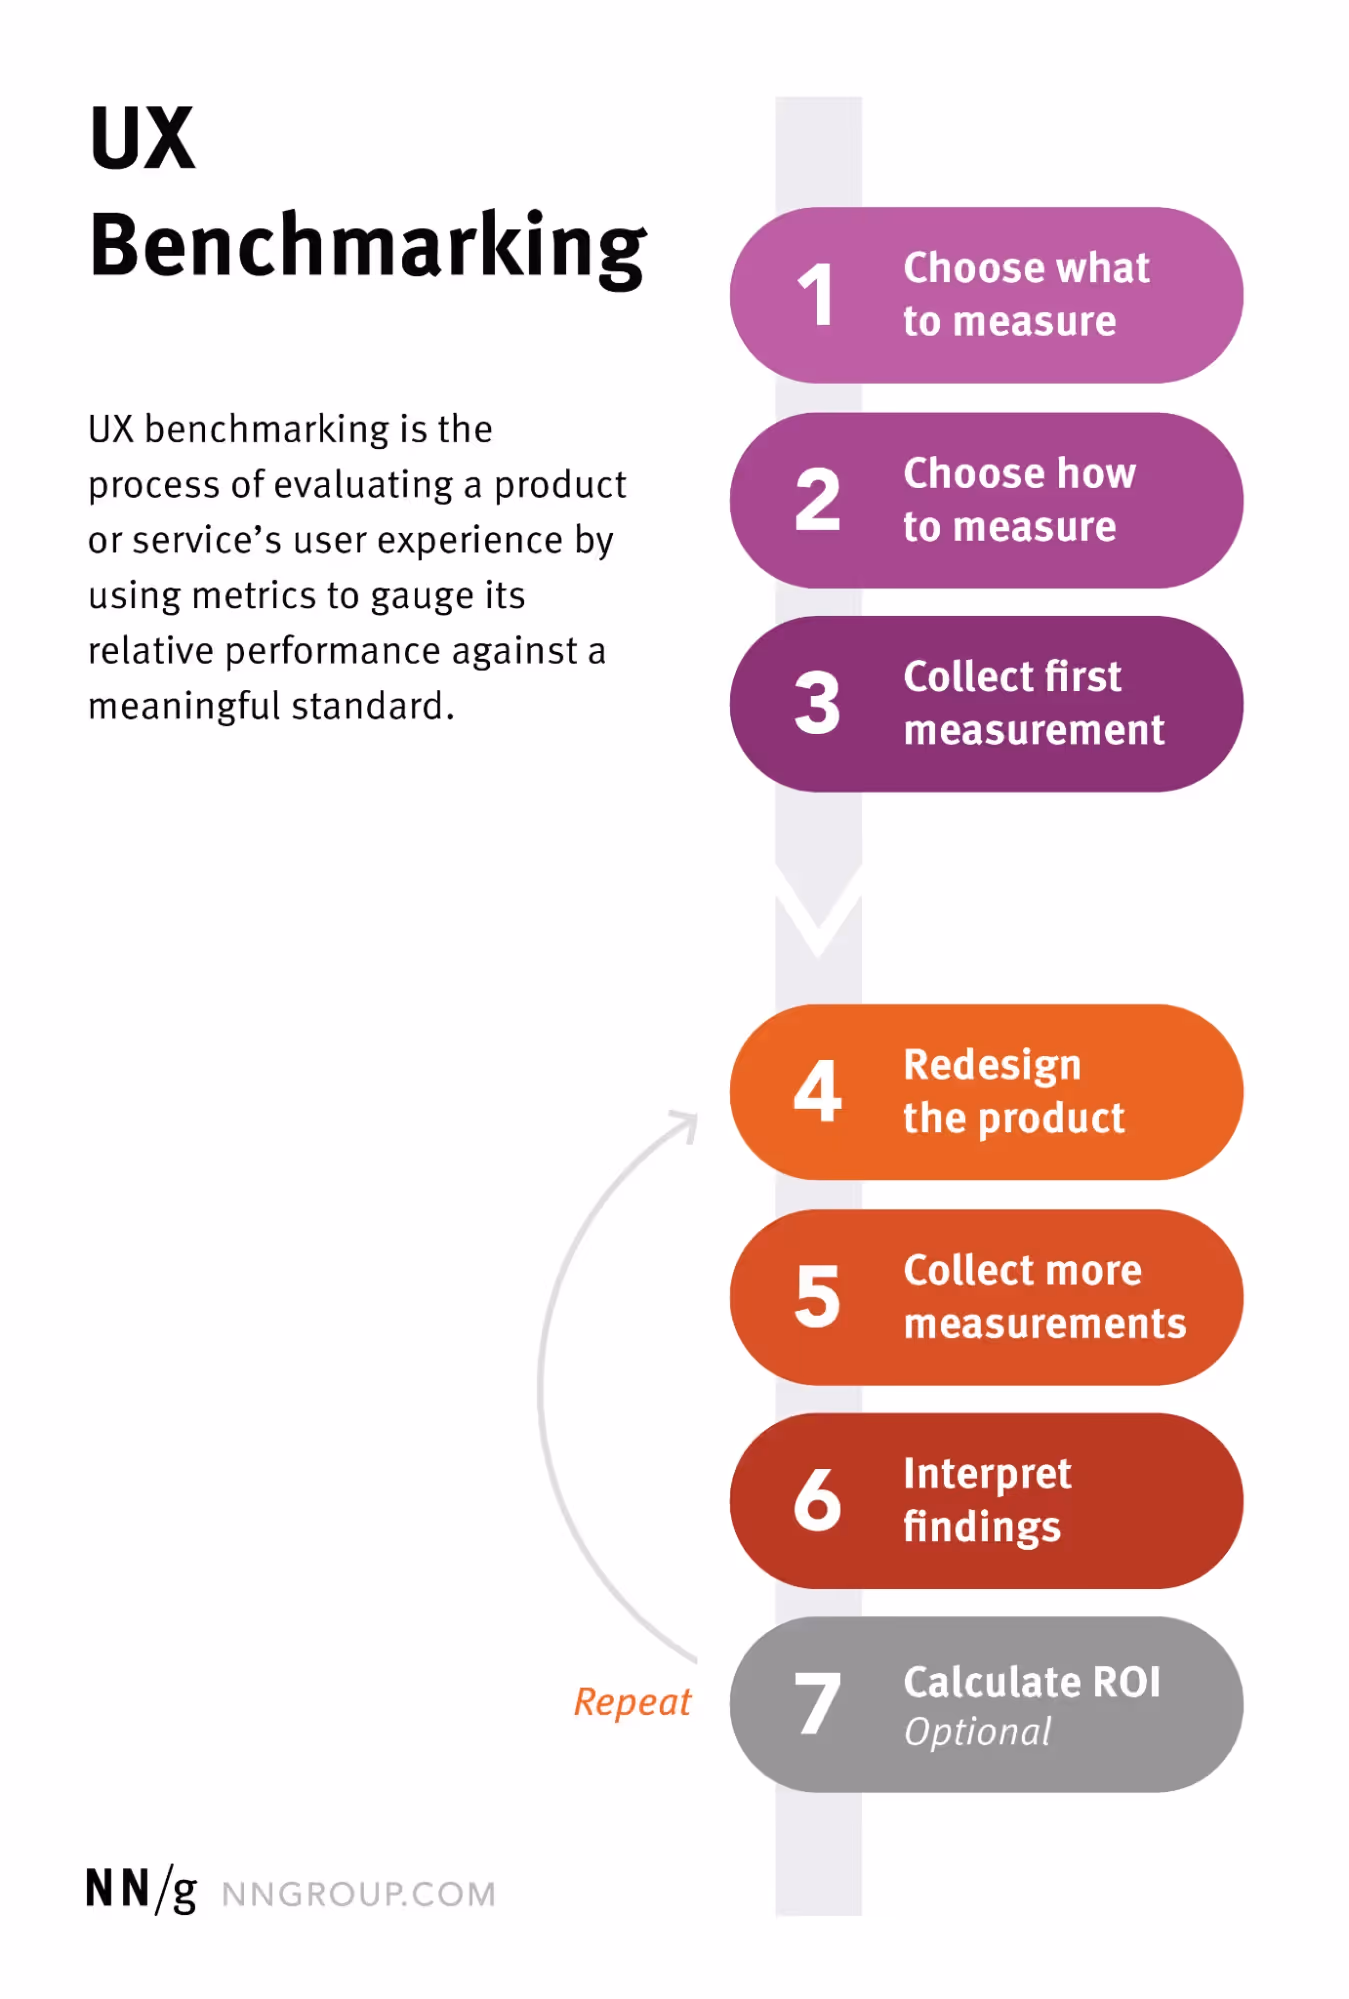
Nielsen Norman Group lays out a seven‑step process, which we adapt here for early‑stage teams:
- Define goals and scope: Clarify what you’re measuring (e.g., checkout flow, onboarding) and who the users are. Determine whether you’re comparing against a past version or a competitor.
- Select meaningful metrics: Choose metrics that reflect both usability and user sentiment. Success rate, time on task, error count and satisfaction rating are a solid starting point. If adoption and retention matter, include metrics like new accounts created, feature usage or churn.
- Pick stable tasks or scenarios: Identify the top tasks that drive value for your users and your business. Write clear task scenarios so participants know what they need to accomplish.
- Collect baseline data: Run the study on your current product to gather initial metrics. This is your reference point.
- Compare over time or with competitors: After you redesign or when evaluating competitor products, run the same tasks with the same metrics. For competitive studies, recruit users who match your target persona and test at least three comparable products. Baymard’s method of manually assessing ten digital subscription services across 240+ parameters shows how structured competitor benchmarking can be.
- Analyse changes and draw insights: Look at trends. Did success rates improve? Did time on task drop? Pair the numbers with qualitative observations and user comments to understand why.
- Iterate and repeat: Benchmarking is a program, not a one‑time exercise. After acting on insights, repeat the process to validate improvements and catch new issues. Document your methodology so future studies remain consistent.
Where to Focus First: The 80/20 Rule in UX
The Pareto principle (80/20 rule) states that 80% of consequences come from 20% of causes. The GeeksforGeeks article on UX design explains that the law originated from Vilfredo Pareto’s observation of wealth distribution and was later applied to quality control by Joseph Juran. In a UX context, this means a small number of features or interactions often drive most of the user experience. The article suggests identifying the “vital few” tasks that contribute most to user dissatisfaction and focusing on those.
For a startup, this principle is a lifesaver. Instead of spreading your limited resources across every corner of the product, identify the handful of flows that matter most (e.g., onboarding, search, checkout). Conduct UX benchmarking on those tasks first. Use metrics to uncover where users struggle and prioritise those fixes. By improving the 20% of interactions that cause most problems, you often remove the majority of friction.
Key UX Attributes to Track or Compare
Peter Morville’s UX honeycomb identifies seven facets that shape a great user experience: useful, usable, findable, credible, desirable, accessible and valuable.
- Useful: Ask whether your product truly solves a user problem. Benchmarks for usefulness include task success rates and the percentage of features actually used.
- Usable: Ease of use remains vital. Metrics: time on task, error rate, System Usability Scale (SUS) scores.
- Desirable: Emotional appeal influences perception. Track satisfaction scores, NPS, and user comments about aesthetics.
- Findable: Navigation and search must help users locate what they need. Metrics: navigation failures, search success rate, bounce rate from key pages.
- Accessible: Accessibility ensures that people with disabilities can use your product. Benchmarks include compliance with WCAG guidelines and results from screen‑reader tests.
- Credible: Users need to trust your product. Stanford’s Web Credibility project emphasises elements that influence trust. Metrics: trust survey scores, support tickets about misinformation.
- Valuable: The experience must contribute to business or mission goals. Metrics: conversion rate, retention, revenue per user.
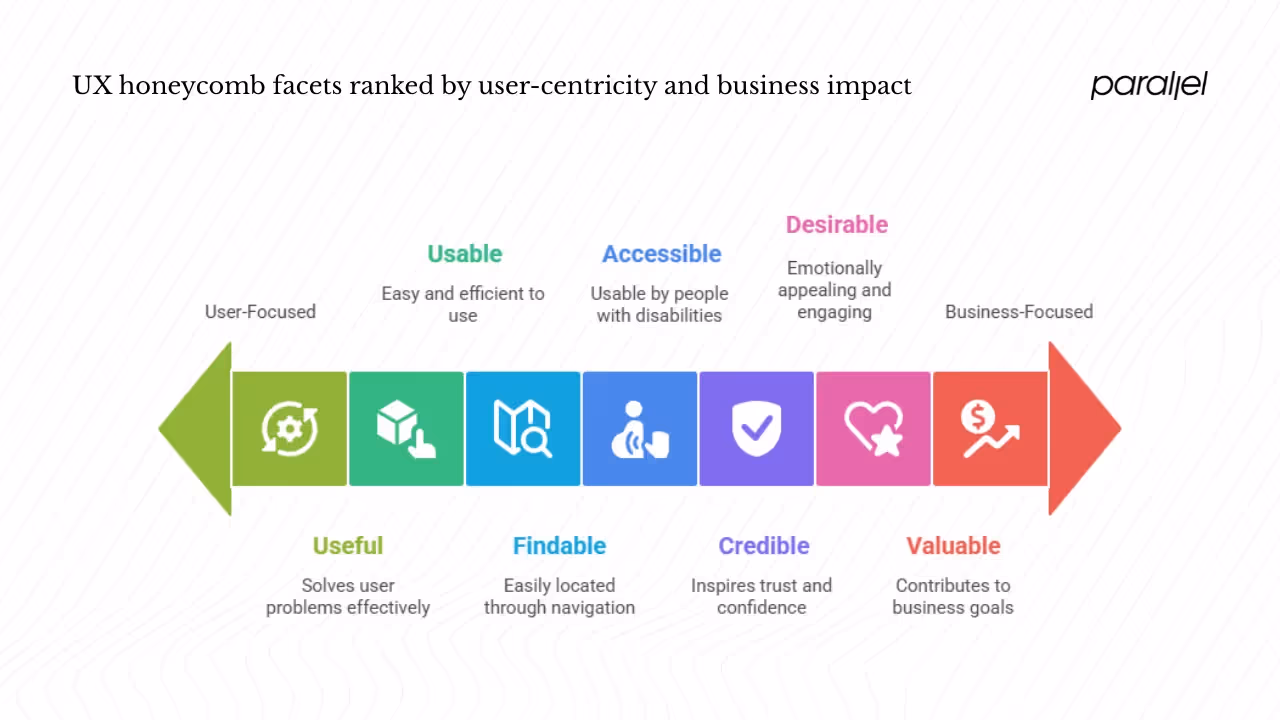
Using these facets as lenses helps structure your benchmarking efforts. For each facet, pick a couple of metrics and compare them over time or against competitors.
Interpreting Results and Avoiding Pitfalls
Benchmarking data is only useful if we interpret it wisely. Common pitfalls include:
- Inconsistent methods: Changing the tasks, participants or context between tests skews results. Keep the study design consistent.
- Ignoring context: Metrics can mislead without context. For example, a longer time on task isn’t always bad; users might spend longer because they enjoy browsing. Pair quantitative metrics with qualitative feedback to understand “why.”
- Small samples: Very small participant numbers can produce noisy data. While early-stage teams often run with five to eight users, treat these results as directional and replicate with larger samples when possible.
- Overlooking external factors: Changes in user demographics, device types or marketing campaigns can influence metrics. Make sure you’re comparing like with like.
- Chasing vanity metrics: High NPS scores or conversion rates feel good but may not reflect the experience of your key users. Focus on the metrics tied to your defined goals.
Blend numbers with narratives. Watch session recordings, read open‑ended survey responses and interview users. A spike in error rate may correspond to a confusing icon or poorly labelled button. Qualitative insights reveal these nuances.
Bringing It All Together: A Benchmarking Workflow
A simple workflow ties everything together:
- Define key performance indicators (KPIs) and benchmarks: Choose metrics aligned with user goals and business outcomes.
- Run testing or collect data: Conduct usability tests, surveys and analytics reviews to gather baseline metrics.
- Compare to baseline or competitors: Use the same tasks and metrics across releases and competitor products to see relative strengths and weaknesses.
- Identify pain points and opportunities: Look for metrics that fall short and pair them with qualitative insights to understand why.
- Prioritise via 80/20: Focus on the few interactions that drive the majority of friction or value.
- Act, iterate and repeat: Implement changes, run another round of tests and document the results. Benchmarking is a continuous cycle.
At Parallel we’ve used this workflow with AI‑driven SaaS products. For one client, initial benchmarking showed only 60% of users could complete onboarding without help and average time to value was nine minutes. We mapped the first‑use journey, prioritised the top two friction points (data import and model training), simplified those flows and measured again. Success rates jumped to 85% and time to value dropped to four minutes. By focusing on the “vital few,” we made a big impact without redesigning the entire platform.
Conclusion
UX benchmarking is not a buzzword; it’s a practical tool that helps founders, product managers and design leaders make evidence‑based decisions. It replaces anecdotal feedback with data, identifies where limited resources should go and shows whether our work actually makes the experience better. Teams that adopt benchmarking see tangible returns: Baymard reports that each dollar invested in a thoughtfully designed experience can return $100. For startups, that can be the difference between finding product‑market fit and burning through cash without insight. Start small, focus on the key flows, measure consistently and let the data guide you. Over time you’ll build a rich archive of UX performance that informs every design move.
FAQ
1) What is the 80/20 rule in UI/UX design?
The 80/20 rule, also called the Pareto principle, states that roughly 80% of outcomes come from 20% of causes. In UX, this means a small set of features or interactions drive most of the user experience. A GeeksforGeeks article on the Pareto principle notes that the concept comes from Vilfredo Pareto’s observation that a minority of factors produce most results. Designers can apply this by identifying the tasks that cause most user dissatisfaction and focusing improvements there.
2) How do you measure UX performance?
Start by defining metrics that capture effectiveness (task success rate), efficiency (time on task), errors (error count), and satisfaction (post‑task rating). Collect baseline data through usability tests or analytics, then run the same measurements after a redesign or on competing products. Nielsen Norman Group suggests that benchmarking programs repeat measurements across releases to track progress. Combining quantitative data with qualitative feedback provides a fuller picture.
3) What are the three main types of benchmarking?
- Internal benchmarking: compare performance across versions of your own product or between teams.
- Competitive benchmarking: evaluate your product against direct competitors to see where you stand. Baymard’s 2024 SaaS benchmark, for example, assessed ten digital subscription services across 240+ parameters and produced 2,300+ performance scores.
- Best‑practice (normative) benchmarking: compare your performance to industry standards or research‑based guidelines. This could involve adopting parameters from established frameworks like Google’s HEART metrics or Baymard’s e‑commerce guidelines.
4) What are the 7 attributes that affect UX?
Peter Morville’s UX honeycomb lists seven facets: useful, usable, desirable, findable, accessible, credible and valuable. “Useful” asks whether the product meets a real need. “Usable” focuses on ease of use. “Desirable” relates to emotional appeal. “Findable” covers navigation and information architecture. “Accessible” ensures people with disabilities can use the product. “Credible” addresses trust. “Valuable” ensures the experience delivers business or mission value.

check out these related blogs


.avif)


.webp)