Why does this simple metric stir up so much conversation among founders and product leaders? Because it tells you how strong your subscription engine really is. Annual recurring revenue (ARR) measures the money you can confidently expect every year from active subscriptions. In this guide I’ll share how I approach ARR: how I define it, why it matters for product‑led businesses, and how design and product decisions influence it. By the end you’ll know what ARR is, how to calculate it, and how to use it to make better choices about product, growth, and hiring.
What is ARR?
ARR is the yearly value of all active, recurring subscription contracts. Unlike total revenue, which includes one‑off sales and services, ARR only counts money that arrives regularly. If your SaaS product generates ₹80 lakh per year from subscriptions and another ₹20 lakh from setup fees or consulting, the ARR is ₹80 lakh. That recurring component matters because it makes revenue predictable; investors and teams use it to gauge customer loyalty and future growth. In practice this metric is synonymous with stability, so product teams treat ARR as a signal of how well the subscription model is working.
Why ARR is important for startups & product teams
As a founder or product manager, recurring revenue is your heartbeat. It tells you if customers are sticking around and whether your business model can support future investment. A high ARR relative to one‑off revenue suggests that your product delivers ongoing value and that users see it as essential. This insight helps you forecast cash flow, size your team and decide when to add features or expand markets. It also prevents you from being misled by a spike in one‑time sales; without recurring revenue growth, that uptick could evaporate next year.
Design and product leaders shape ARR every day. When we refine onboarding flows, simplify workflows or improve performance, we reduce churn and raise expansion revenue. McKinsey’s research on the business value of design showed that companies in the top design quartile increase revenue and shareholder returns 32 percentage points faster than their peers. Forrester has found that well‑designed websites can deliver conversion rates up to 400% higher than poorly designed ones and reduce page‑abandonment by 41%. In my work with AI and SaaS startups, improving usability often slashes churn and boosts upgrade rates.
Investors pay attention to ARR because it signals reliable cash flow. Many venture and private‑equity deals use ARR multiples to value a business. If you show solid ARR growth and a low churn rate, you can command a higher valuation than a company with the same total revenue but less predictability. ARR also informs hiring and resource allocation; if expansion revenue is rising, you may scale the product or customer‑success team. If contraction outweighs expansion, it may be time to revisit your core offering.
How to calculate ARR
Basic formula
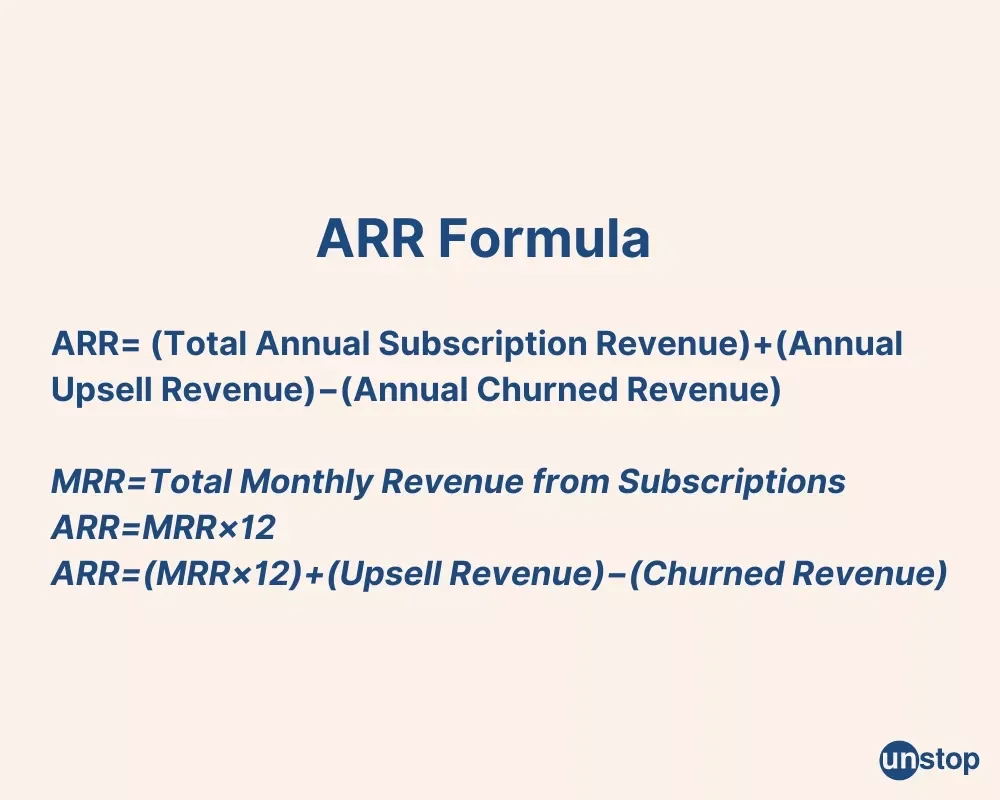
For businesses that bill monthly, the simplest way to estimate ARR is to multiply monthly recurring revenue (MRR) by 12:
ARR = MRR × 12
MRR is your total subscription revenue in a given month. If you earned ₹8 lakh in recurring revenue last month, the approximate ARR is ₹96 lakh. This straightforward approach works when contract values stay consistent and there aren’t significant upgrades or downgrades during the year.
Detailed formula
A more accurate calculation breaks ARR into its moving parts:
ARR = Starting ARR + New ARR + Expansion ARR – Contraction ARR – Churned ARR
- Starting ARR: your ARR at the beginning of the period.
- New ARR: revenue from newly acquired customers.
- Expansion ARR: additional revenue from existing customers who upgrade or purchase add‑ons.
- Contraction ARR: revenue lost when customers downgrade.
- Churned ARR: revenue lost when customers cancel entirely.
For example, suppose you start the year with ₹50 lakh ARR. You add ₹15 lakh in new subscriptions and ₹5 lakh in upsells. At the same time, ₹3 lakh worth of accounts downgrade and ₹2 lakh cancel. The ending ARR equals:
₹50 lakh + ₹15 lakh + ₹5 lakh – ₹3 lakh – ₹2 lakh = ₹65 lakh
This decomposition helps you see how product decisions influence growth. A successful new feature that encourages premium upgrades increases Expansion ARR. A confusing UI that drives users to cancel increases Churned ARR. Tracking these components helps you diagnose issues and prioritise improvements.
What to include and exclude
ARR should reflect predictable subscription revenue. Exclude one‑time implementation fees, consulting services, hardware sales, or usage‑based charges that fluctuate. Shopify’s guide explains that if a company generated $11 million total revenue and $10 million came from subscriptions, the ARR is $10 million. Multi‑year contracts can be annualised: a three‑year deal worth ₹30 lakh counts ₹10 lakh toward ARR each year. Monthly plans can also be converted by annualising their recurring portion.
ARR vs other metrics
ARR vs MRR
| Item | ARR | MRR |
|---|---|---|
| Time scope | Yearly baseline of recurring revenue | Month-to-month recurring revenue |
| What it shows | Big-picture traction and stability | Trend changes, seasonality, and quick shifts |
| When it helps | Planning hiring and future fund-raising | Forecasting cash for the next few months |
| Risk of misuse | Moves slowly, so early trouble can hide | Can exaggerate short-term bumps or dips |
ARR vs total revenue
| Item | ARR | Total Revenue |
|---|---|---|
| What’s included | Only contracted recurring income | Subscriptions, service work, one-offs, and other items |
| Insight it gives | Strength of the subscription engine | Full top-line figure |
| Where it shines | Checking how stable and predictable revenue is | Reporting and accounting |
| Risk of misuse | Nonequivalent to full revenue, so context matters | Can create a false sense of growth when spikes come from non-recurring deals |
ARR vs renewal rate and churn rate
| Item | ARR | Renewal Rate | Churn Rate |
|---|---|---|---|
| What it measures | Total recurring revenue locked in for a year | Share of customers that keep their subscriptions at the same level | Share of customers that leave or reduce usage |
| How they connect | Renewal and churn shift ARR up or down | Affects stability and NRR | Direct hit to ARR and NRR |
| Use in practice | Gauging long-range strength and durability | Shows how well you keep customers | Signals retention trouble |
| Growth signal | Rises with strong retention and expansion | High renewal supports steady ARR | High churn weakens ARR even if new sales look strong |
Expansion ARR, NRR, and growth reference
| Item | Meaning | Insight |
|---|---|---|
| Expansion ARR | Extra recurring revenue from upsells or higher-tier plans | Lifts retention metrics and offsets churn |
| NRR | Recurring revenue from renewals plus expansion divided by starting ARR | Strong indicator of product strength |
| Growth finding | A 2025 B2B SaaS study showed that companies with the highest NRR saw median growth about 83% higher than the overall median | High NRR usually signals strong product value and low churn |
ARR benchmarks & growth for 2025
Growth expectations vary by stage. In early‑stage SaaS (<$1 million ARR), high‑growth companies often aim for over 60% annual growth. As ARR increases, growth rates slow: private B2B SaaS firms surveyed by Benchmarkit reported median growth of 26% in 2024, with the top quartile hitting 50%. Drivetrain.ai summarised typical growth targets: around 100% for companies under $1 million ARR, 45% for $1–5 million, 27% for $5–20 million, dropping to 6% for those above $100 million. These benchmarks help you set realistic targets and communicate with investors.
Net revenue retention has become a key focus in 2025. Benchmarkit’s report shows that expansion ARR now accounts for 40% of new ARR, a 5% increase from the previous year. Meanwhile, the new customer acquisition cost (CAC) ratio increased by 14%, meaning companies spend about $2 to generate $1 of new ARR. Higher NRR offsets rising acquisition costs, so product teams are expected to prioritise expansion and retention.
Subscription fatigue is another challenge. Research in 2025 notes that there are over 42 000 SaaS companies worldwide and the average organisation uses 112 SaaS applications. U.S. consumers spend about $273 per month on 12 paid subscriptions, and half of respondents reported cancelling or planning to cancel a subscription due to fatigue. This environment makes differentiation and user‑centric design more important than ever.
How product and design teams influence ARR
Design isn’t just about aesthetics; it’s about removing friction and enabling value. Here’s how product and design decisions affect ARR:
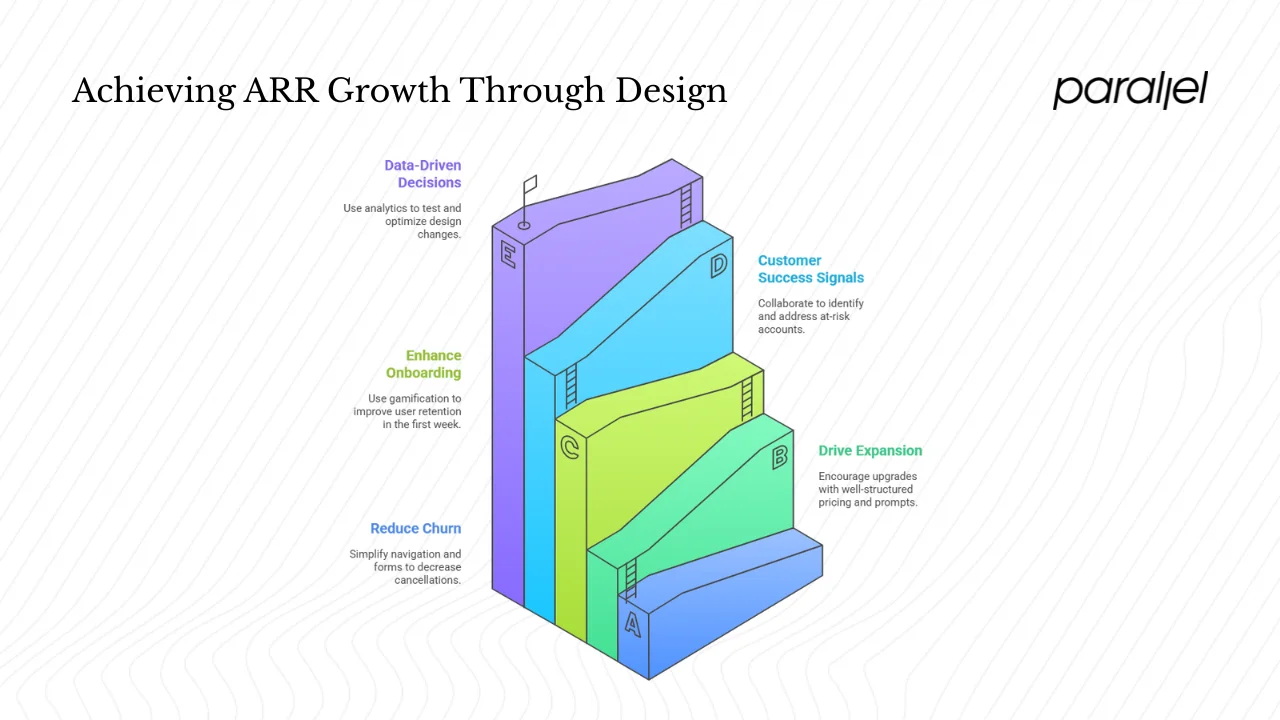
- Reducing churn: A confusing checkout process or a feature that doesn’t deliver on its promise drives cancellations. A case study of the ecommerce platform Supacart showed that a redesign that clarified navigation and simplified forms cut churn from 8.2% to 2.2% and saved $100 for every $1 spent on UX improvements. Studies also show that 88% of users who face multiple UX issues never return.
- Driving expansion: Well‑structured pricing tiers and in‑app prompts encourage customers to upgrade. In my work with a SaaS platform, adding a mid‑tier plan and repositioning premium features led to a 30% increase in Expansion ARR within six months. Good design surfaces value at the right moments, encouraging users to adopt add‑ons or higher tiers.
- Onboarding and guidance: Users judge products quickly. The first seven days are critical for retention. At Duolingo, gamified onboarding increased seven‑day retention by 40%, according to design statistics. On the flip side, unstructured onboarding leads to confusion and churn.
- Customer success signals: Product analytics can highlight accounts at risk of cancellation. When designers collaborate with customer success teams, they can surface warnings—declining usage, unpaid invoices, negative feedback—so teams can intervene. Proactively reaching out before a subscription renews or before a user hits a usage threshold can turn a potential cancellation into an upsell.
- Data‑driven decisions: Use analytics to test changes. For example, A/B testing a new dashboard might reveal a 15% increase in daily active users. Better engagement translates into longer contracts and more opportunities for upsells.
UX and product design are often undervalued in SaaS. Yet McKinsey’s research shows design‑driven companies grow 32% faster, and Forrester’s study reports that well‑designed sites can yield conversion rates up to 400% higher. These numbers highlight that design decisions are revenue decisions.
How founders & PMs should use ARR in strategy
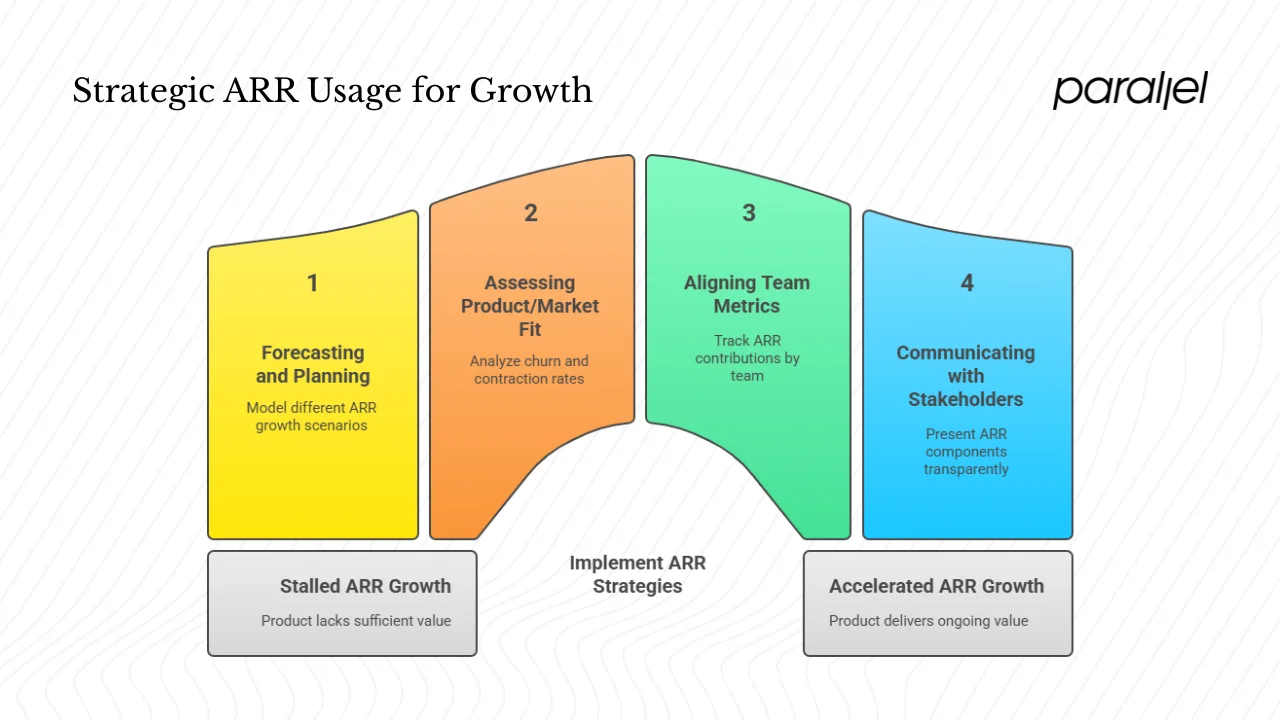
1) Forecasting and planning
Forecasting starts with understanding the drivers of ARR. Use your current ARR and the detailed formula to model different scenarios: What if you increase New ARR by 20%? What happens if churn rises by 2 percentage points? These insights inform budgets, hiring, and product investments. ARR also provides confidence when approaching investors; a steady upward trend demonstrates product‑market fit and disciplined growth.
2) Assessing product/market fit
If ARR growth stalls despite active sales efforts, it may signal that your product isn’t delivering enough value. Look at churn and contraction. High churn means users don’t see ongoing value; they may have trialled the product and left. High contraction means your pricing or features don’t match the needs of your customers. Use customer interviews and analytics to pinpoint pain points, then adjust the roadmap accordingly.
3) Aligning team metrics
ARR aligns multiple teams around a shared goal. Marketing and sales can track cost per new ARR dollar; customer success can monitor churned ARR; product can follow expansion ARR. Benchmarkit’s 2024 data shows that the blended CAC ratio decreased by 10% because companies generate more expansion ARR. This demonstrates the leverage of existing customers. When each team understands its role in ARR, decisions become more strategic.
4) Communicating with stakeholders
Investors and boards expect clarity. Instead of highlighting total revenue, present ARR and its components. Explain how design improvements decreased churn or how a new pricing model increased expansion. Be transparent about definitions: exclude non‑recurring revenue and state whether multi‑year deals are annualised. This transparency builds trust and makes it easier to secure funding.
Avoiding common mistakes
Common pitfalls include:
- Counting one‑time fees as recurring. This inflates ARR and leads to unrealistic forecasts.
- Ignoring churn and contraction. New sales can mask churn, but the net effect may be flat or negative.
- Inconsistent definitions across teams. Agree on what counts as recurring revenue and how to annualise contracts.
- Over‑indexing on low‑quality signups. Giving away free trials without guidance can produce high New ARR that quickly churns.
Practical steps to increase ARR
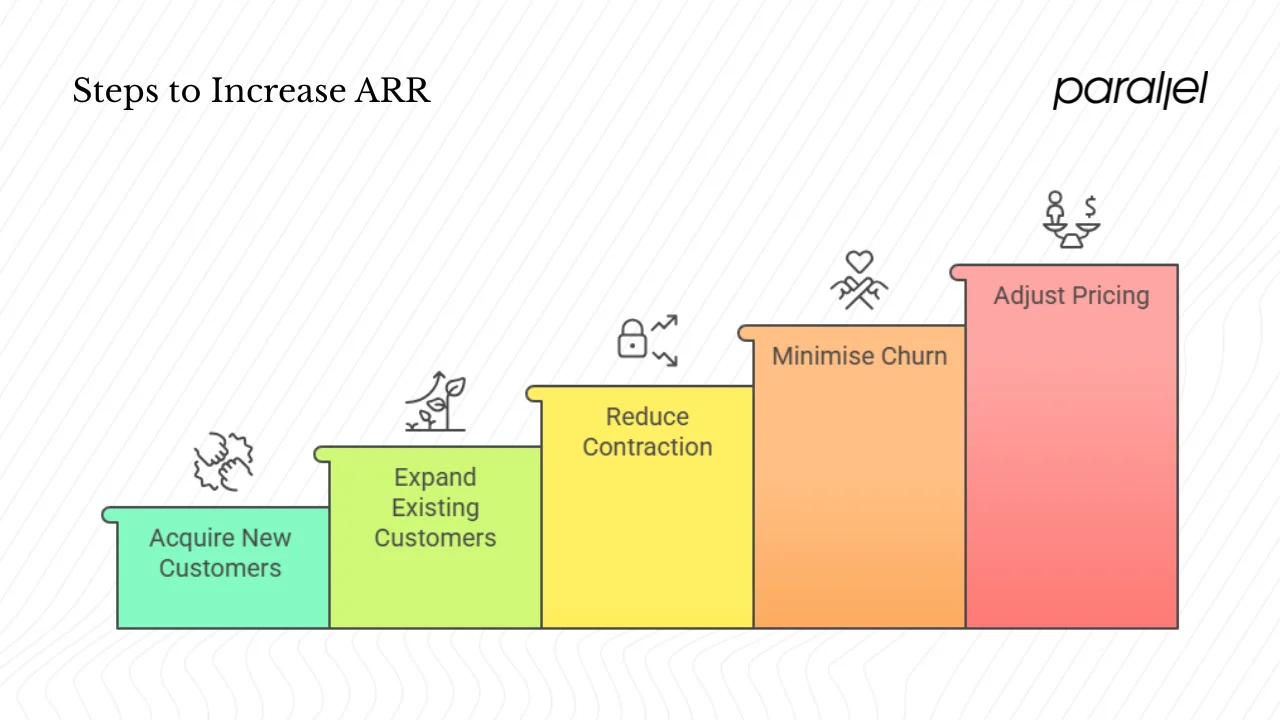
1) Acquire new customers (New ARR)
Identify your ideal customer profile. For early‑stage teams, focus on a narrow segment where your product delivers outsized value. Use product‑led acquisition strategies: free trials, freemium tiers, or self‑serve onboarding. Provide guidance in the product to help new users achieve success quickly; this reduces trial churn and increases conversion to paid plans.
2) Expand existing customers (Expansion ARR)
Design pricing tiers that reflect distinct customer needs. Offer add‑on modules or usage‑based upgrades. In‑product messaging can prompt upgrades when users hit usage limits or show interest in advanced features. The key is to time these prompts when customers experience value, not as a pushy upsell.
3) Reduce contraction and downgrades
Monitor usage patterns. If customers use only a small fraction of their plan, they may downgrade at renewal. Consider flexible plans that allow them to scale up or down without penalty, but also ensure your product delivers value across tiers. Provide educational content or features that encourage adoption of under‑used capabilities.
4) Minimise churn (Churned ARR)
Proactive support is more cost‑effective than acquisition. It costs five to seven times more to acquire a new customer than to retain an existing one. Use surveys, net promoter scores, and behaviour analytics to identify at‑risk accounts. Reach out with personalised support or incentives before renewal. Simplify cancellation flows so you learn why users leave; use this feedback to improve the product.
5) Pricing and packaging adjustments
Annual contracts provide revenue predictability. Consider offering discounts for annual commitments; this locks in revenue and reduces monthly churn. However, keep the discount reasonable so you don’t attract price‑sensitive customers who leave when the contract ends. Test different pricing structures and measure impact on ARR growth and churn.
Challenges and limitations of ARR
ARR is a valuable metric but not a perfect one. It assumes that subscriptions will continue at the same rate. In markets with high churn risk or volatile usage, ARR may overstate predictability. Businesses that mix subscription and services may find that ARR obscures the true picture; hardware sales or one‑off training could account for a large share of revenue. In 2025, rising subscription fatigue means some customers may cancel en masse, leading to sudden ARR declines. Your definitions and calculations must be consistent; different companies count upgrades or discounts differently, so comparing ARR across firms can be tricky. Use ARR alongside other metrics like LTV, gross margin, and cash burn for a fuller view.
Conclusion
ARR is more than a finance metric; it’s a lens on your product’s relationship with users. It helps founders, product managers and design leaders understand whether their subscription engine is healthy and where to invest next. By tracking the components of ARR—new, expansion, contraction and churn—you gain a detailed picture of what drives growth or decline. Improving design and user experience can materially reduce churn and increase expansion, as studies from McKinsey, Forrester, and multiple case studies show.
I encourage every founder and product leader to review how they currently measure ARR. Make sure you exclude one‑time revenue, break ARR into its components, and use insights to prioritise retention and expansion initiatives. Share these insights with your team so everyone understands the role they play in building sustainable recurring revenue. The FAQs below answer some common questions about ARR.
Frequently asked questions
1) What does ARR mean in business?
In business, annual recurring revenue (ARR) is the total value of recurring subscription contracts measured over a year. It shows how much predictable income a company expects from customers who pay on a monthly or annual basis. ARR is crucial for subscription‑based businesses because it highlights the steady portion of revenue and allows for better forecasting and valuation.
2) What does ARR mean?
ARR stands for annual recurring revenue. It’s a metric used mainly by SaaS and subscription businesses to quantify yearly revenue from recurring sources. Unlike one‑time sales, recurring revenue is predictable and provides a foundation for sustainable growth.
3) How is ARR calculated?
You can calculate ARR by annualising monthly recurring revenue (MRR × 12) or by summing new and expansion revenue and subtracting contraction and churn over a year: ARR = Starting ARR + New ARR + Expansion ARR – Contraction ARR – Churned ARR. Exclude one‑time fees, consulting revenue, or other non‑recurring charges to keep the metric accurate.
4) What is the simple definition of ARR?
The simplest definition of ARR is: the yearly income a business expects from its subscription or recurring customers. It’s the money that ARRives regularly—month after month—providing a reliable foundation for planning and growth.

check out these related blogs