How do you know if the new onboarding flow that your team shipped last quarter actually helped? For founders and design leads the answer lies in benchmarking. In simple terms, what is a benchmark study? It’s a research method that compares the current performance of a product or process against a standard or past performance to understand progress. In our work with early‑stage SaaS teams, we use benchmarking to cut through intuition and answer the question “did this change make a real difference?” This article explains the concept, shows why it matters, and provides a framework for running effective studies.
What is a benchmark study?
The basic idea is straightforward: collect data on how your product performs and compare it to something meaningful. Maze defines a benchmark study as a research method that measures a product’s usability against a predefined standard, a baseline study or industry best practices. UserTesting’s knowledge base echoes this, noting that benchmark studies measure and compare usability metrics against a baseline study. Nielsen Norman Group, a long‑standing authority on UX, describes UX benchmarking as evaluating a product’s user experience using metrics to gauge its relative performance against a meaningful standard.
A good definition has three ingredients:
- Performance comparison: you measure a set of metrics, often quantitative, and compare them across time, against competitors or against an external standard.
- Industry standards or best practices: the comparison must be meaningful. Maze emphasises that studies draw on baselines or industry best practices.
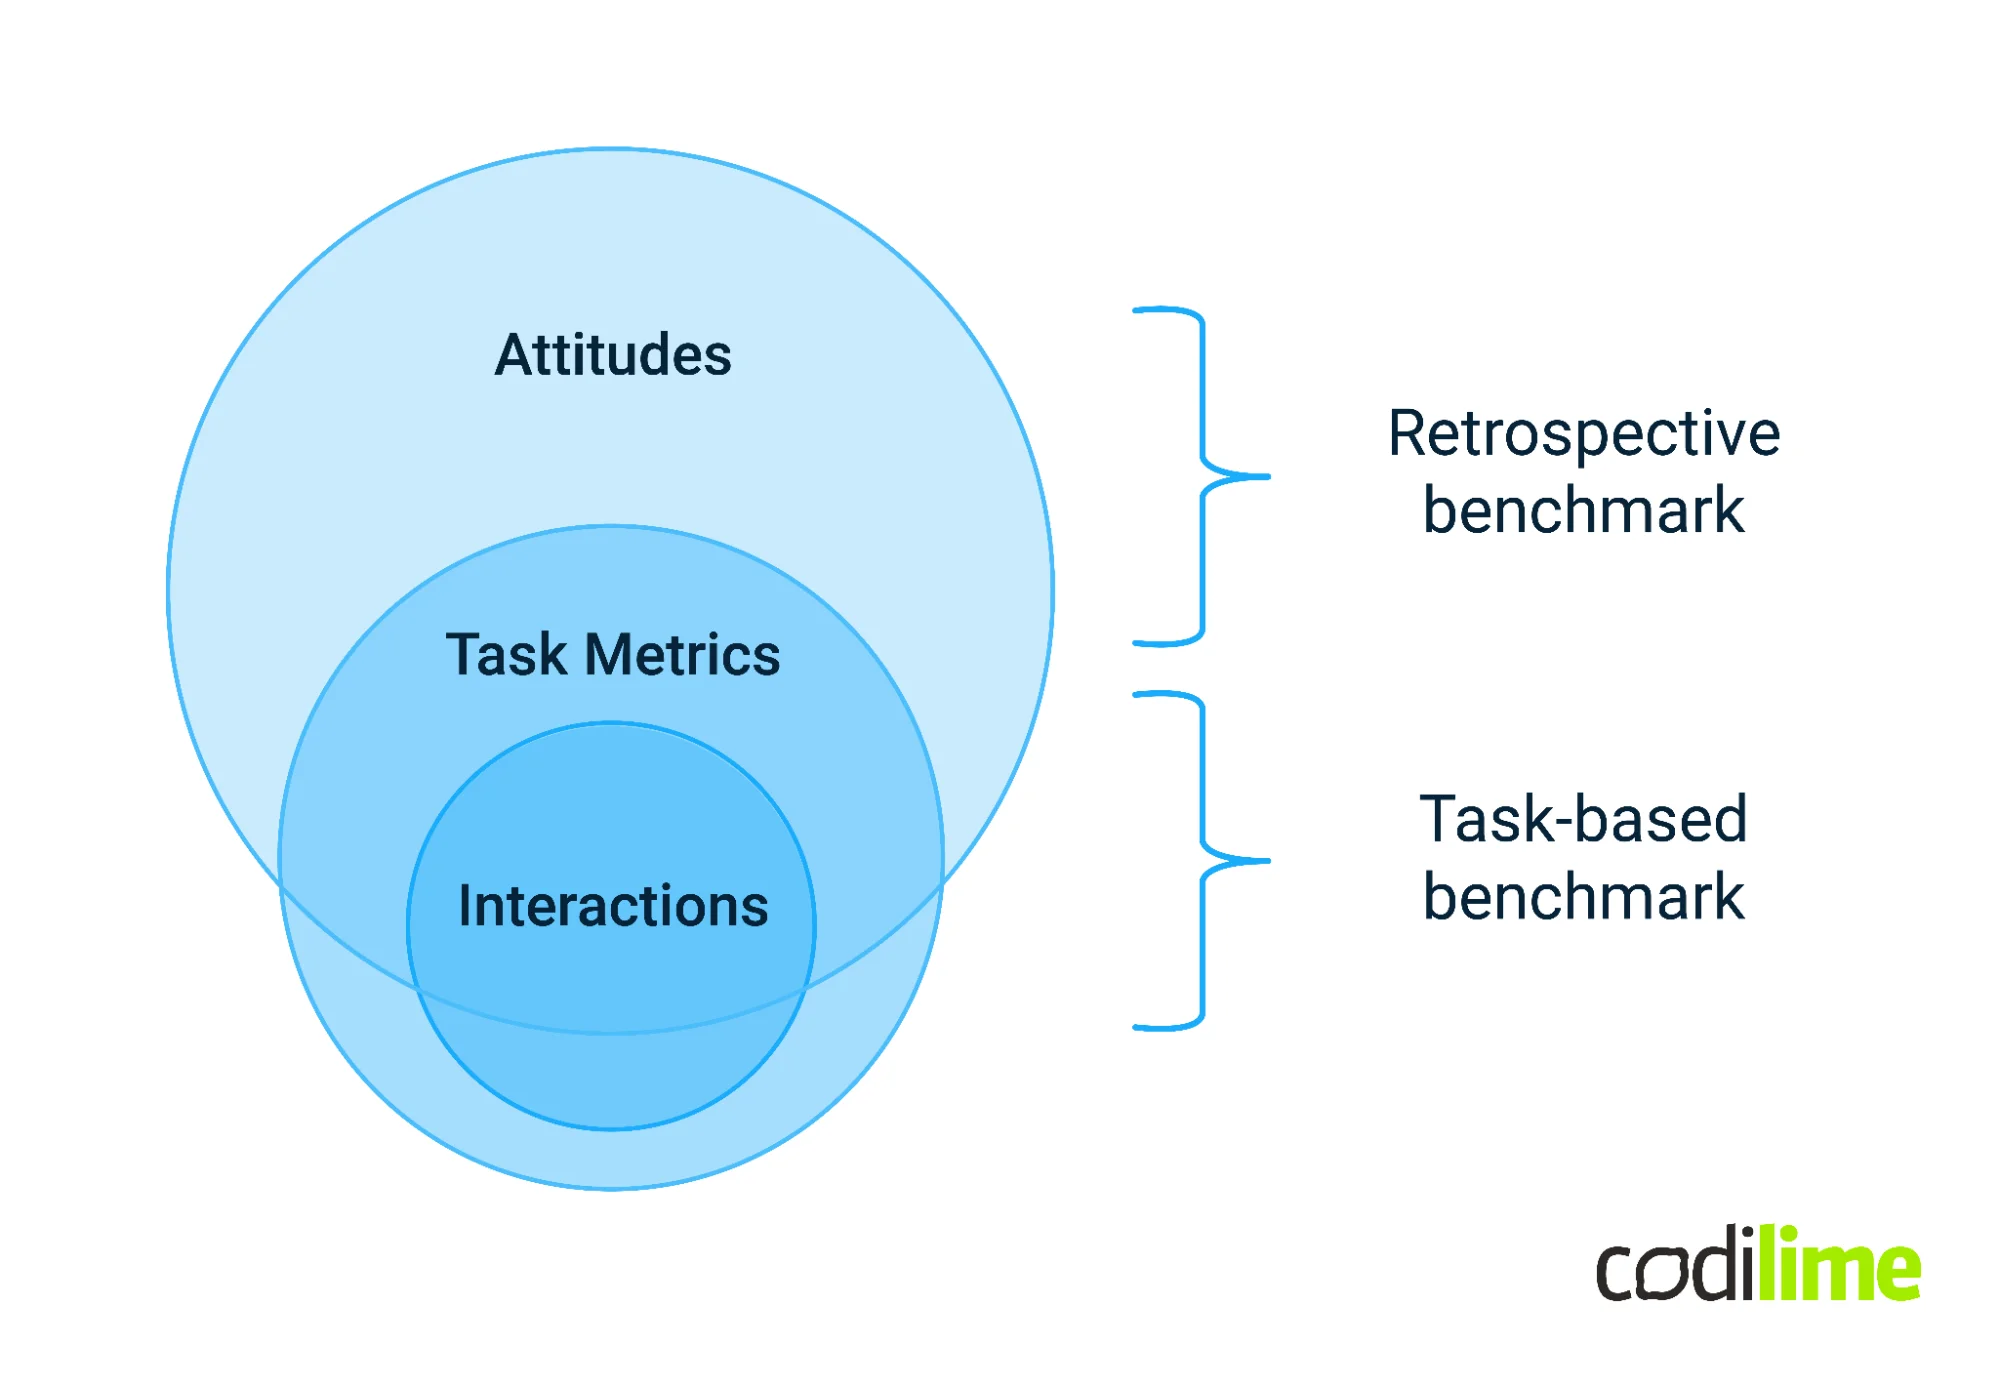
- Evaluation metrics: UserTesting highlights core usability metrics such as task success, errors, time on task and user ratings like satisfaction or ease of use.
A baseline is your current state. A benchmark is the external target or standard. For example, your baseline may be that 60% of users complete onboarding without errors; the benchmark might be the industry average of 80%. This distinction matters: you need a baseline to know your starting point and a benchmark to know where you want to go. Without a baseline, any improvement lacks context; without a benchmark, you lack an aspirational target.
Why benchmark? Value and use cases
Benchmarking answers the question: what is a benchmark study used for? It allows teams to:
- Measure progress over time. By comparing each release against a baseline, you can see if changes have made the product faster, easier or more engaging.
- Do gap analysis. You can identify where you underperform or overperform relative to peers and standards. This helps prioritise improvements.
- Learn best practices. External benchmarks surface what top‑performing products do well.
- Support decisions. Data helps justify investments and prioritise features. In our experience, presenting benchmarking data to investors builds confidence because it shows disciplined progress.
- Demonstrate improvement. Regular benchmarking is a way to report progress to stakeholders and clients. UserTesting notes that metrics across successive studies inform you how successful changes have been.
In product and UX contexts, benchmarking helps you track improvements across versions, compare against competitors and integrate quality management frameworks. It plays a strategic role: you cannot manage what you don’t measure.
Types of benchmarking studies
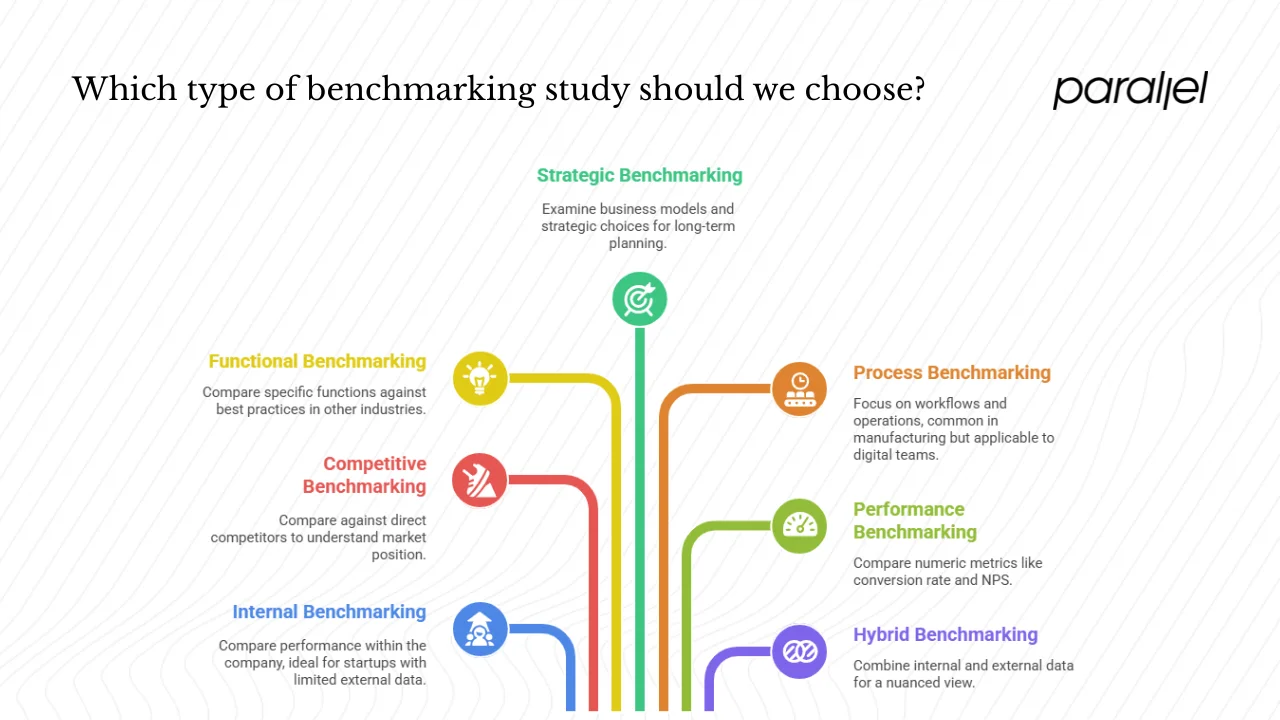
Choosing the right type of benchmarking depends on what you want to compare. These categories help founders and product teams pick the right tool:
- Internal benchmarking: Compare performance across teams, features or versions within your own company. A good starting point for startups, especially when external data is scarce.
- Competitive or external benchmarking: Compare your metrics against direct competitors or peer companies. This helps you understand your position in the market.
- Functional benchmarking: Compare a specific function against best practices in other industries. For example, an education app might compare its “continue studying” feature to streaming services.
- Strategic benchmarking: Examine business models or strategic choices, such as onboarding flows or pricing models, to inform long‑term planning.
- Process benchmarking: Focus on workflows or operations. This is common in manufacturing but applies to digital teams looking at processes like sprint cycles or support ticket handling.
- Performance benchmarking: Compare numeric metrics such as conversion rate, retention or Net Promoter Score (NPS). According to MeasuringU, third‑party benchmarks complement internal programs by providing context.
- Hybrid or cross‑benchmarking: Combine internal and external reference sets, often via data envelopment analysis or similar methods, to provide a nuanced view.
Startups often begin with internal benchmarking and then move to competitive or hybrid approaches as they mature.
The benchmarking process
Frameworks and methodologies
Benchmarking is not a one‑off project; it’s a systematic process. Early benchmarking frameworks emerged from operations management. The American Productivity & Quality Center (APQC) proposes four phases: Plan → Collect → Analyse → Adapt. Robert Camp’s classic model breaks this into 12 stages but the essence is similar: define, measure, analyse, improve, and integrate. Whether you follow APQC or a hybrid model, the underlying steps align.
Detailed steps (adapted for product and UX)
Below is a workflow we use at Parallel when running benchmarking studies for early‑stage SaaS products. This practical approach integrates the big frameworks and adapts them for lean teams.
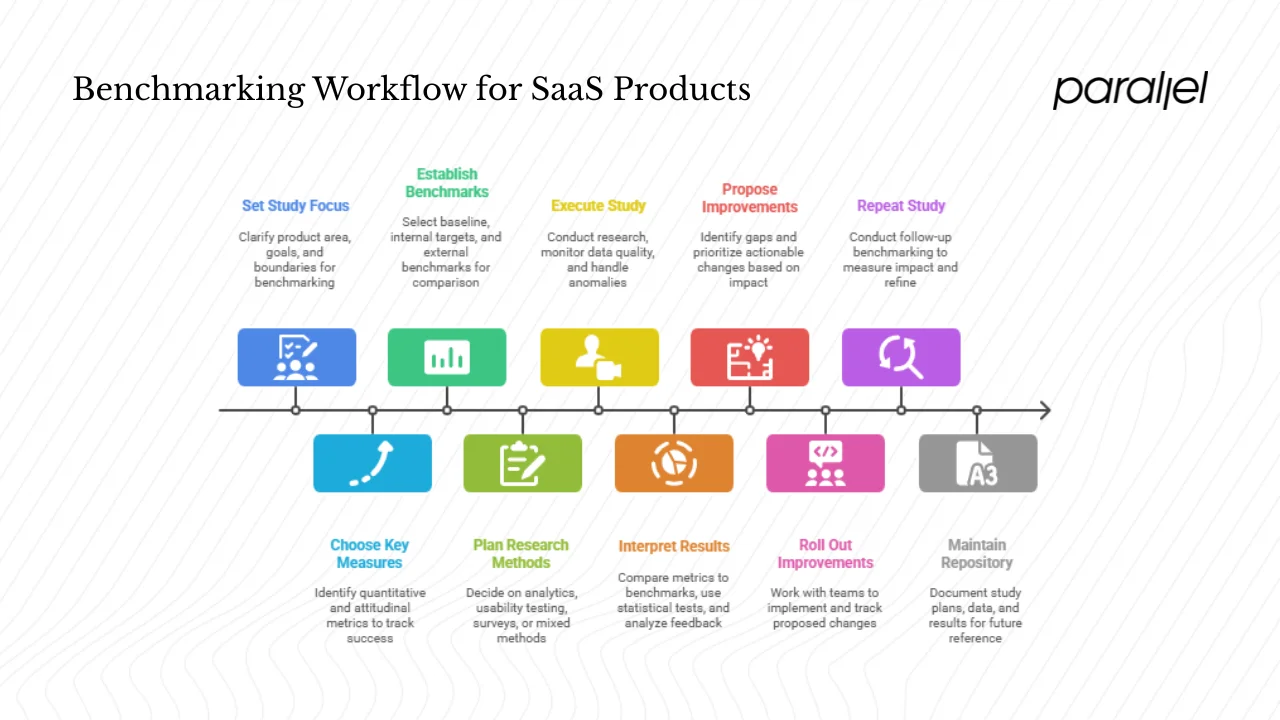
- Define scope and objectives. Determine which part of the product you want to benchmark: onboarding, checkout, feature adoption or a specific customer flow. Clarify why this matters. Is it to reduce drop‑offs, improve satisfaction or increase retention? Set clear boundaries to keep the effort focused.
- Select metrics. Choose quantitative metrics such as task success, time on task, completion rate, conversion rate, retention or Net Promoter Score. Include attitudinal metrics like satisfaction or ease‑of‑use ratings. Document exact definitions—for example, what counts as “success” or “error.” Repeatability demands precision.
- Choose comparators. Identify the baseline (previous version), internal targets and external benchmarks. For external data, you can use industry averages, competitor studies, or third‑party reports. MeasuringU’s 2025 business software report sampled 980 participants to measure usability and NPS across 23 products. Such reports help you set realistic targets.
- Design data collection. Decide on the research methods: analytics, moderated or unmoderated usability testing, surveys, interviews or mixed methods. For quantitative benchmarking you need larger sample sizes than qualitative studies. Ensure consistency: run the same tasks under similar conditions across versions. Pilot the protocol to identify issues before full deployment.
- Collect data. Execute the study, monitor data quality and handle anomalies. Use reliable tools for session recording and log collection. For example, in our projects we often use analytics to capture time‑on‑task and conversion, and combine it with short in‑app surveys.
- Analyse and compare. Compare your metrics to baselines and benchmarks. Use statistical tests to ensure differences are not due to random noise. When we compared onboarding completion between two versions of a SaaS product, we used a z‑test for proportions to confirm that the increase from 55% to 68% was statistically significant at the 95% confidence level. Qualitative insights from user feedback help explain why a metric changed.
- Interpret results and recommend actions. Identify gaps and propose improvements. Prioritise changes based on impact versus effort. For example, a long description that causes confusion might be an easy fix that yields a meaningful gain.
- Implement changes. Work with design and engineering teams to implement improvements. Ensure cross‑functional buy‑in by tying improvements to metrics that matter, such as retention or revenue.
- Re‑benchmark and iterate. Repeat the study after changes are rolled out. Adjust the scope or comparators over time. Benchmarking is a continuous cycle; you need to keep measuring to know whether improvements stick.
- Governance and documentation. Maintain a repository of study plans, raw data, metrics definitions and results. Transparent documentation allows future teams to build upon past work. Share the findings with stakeholders early and often to foster a data‑driven mindset.
Key concepts and considerations
Benchmarking is simple in concept but fraught with pitfalls. The following considerations help avoid common mistakes.
1) Consistency: apples to apples comparisons
For a valid benchmark study you must control variables. Use the same tasks, participant criteria, platforms and devices across versions. Changing any of these undermines comparability. For example, comparing mobile completion rates to desktop baselines without accounting for context will lead to misleading conclusions.
2) Statistical and measurement challenges
Small sample sizes or high variance can obscure true differences. Choose sample sizes large enough to detect meaningful differences. Remove obvious outliers but be cautious—outliers may reveal edge cases that matter to certain user segments. Measurement error is real: ensure participants understand tasks, and use consistent timing methods. Avoid chasing metrics for their own sake; improving numbers without improving user value is a trap.
3) Data ethics, privacy and feasibility
Respect consent, anonymity and data protection regulations. When using third‑party benchmarks, be aware of confidentiality agreements and licensing restrictions. If you operate in regulated sectors (e.g., healthcare), ensure compliance with data‑sharing rules.
4) Benchmark vs causation
A benchmark highlights correlation, not causation. A lower error rate relative to a competitor signals a difference but doesn’t explain why. Use follow‑up experiments (A/B tests) or qualitative research to discover root causes.
5) Over‑benchmarking
Chasing every metric can distract from product vision. Focus on a few high‑impact metrics tied to user outcomes. Too many metrics dilute attention and can lead to local optimisations that hurt the bigger picture.
6) Organisational and cultural forces
Benchmarking often exposes uncomfortable truths. Leadership must support honest reflection and enable change. Internal teams may resist external comparisons; framing benchmarks as opportunities to learn rather than judgement helps. Integrate benchmarking into OKRs or product review cycles to make it part of everyday practice.
Examples and use cases
Onboarding flow improvement
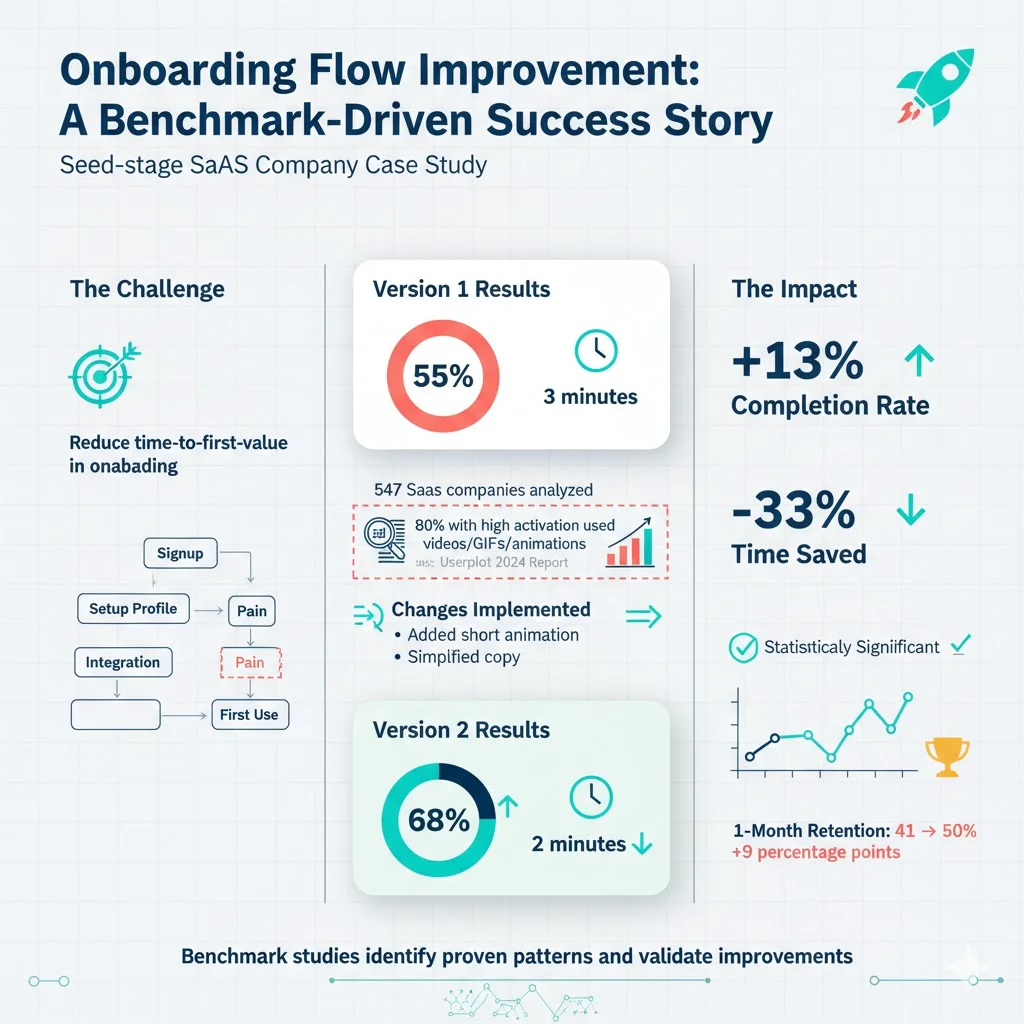
A seed‑stage SaaS company wanted to reduce time‑to‑first value in its onboarding. What is a benchmark study good for in this context? We ran a benchmark: version 1 had a completion rate of 55% with an average completion time of 3 minutes. We benchmarked against the median time reported in Userpilot’s 2024 product metrics report. The report, which analysed 547 SaaS companies, found that 80% of companies with high activation rates used videos, GIFs or animations in onboarding. Inspired by this, we introduced a short animation and simplified copy. In version 2, completion rate jumped to 68% and average time dropped to 2 minutes. We re‑benchmarked after release and confirmed the gains were statistically significant. The improvement also showed up in retention: one‑month retention rose from 41% to 50%.
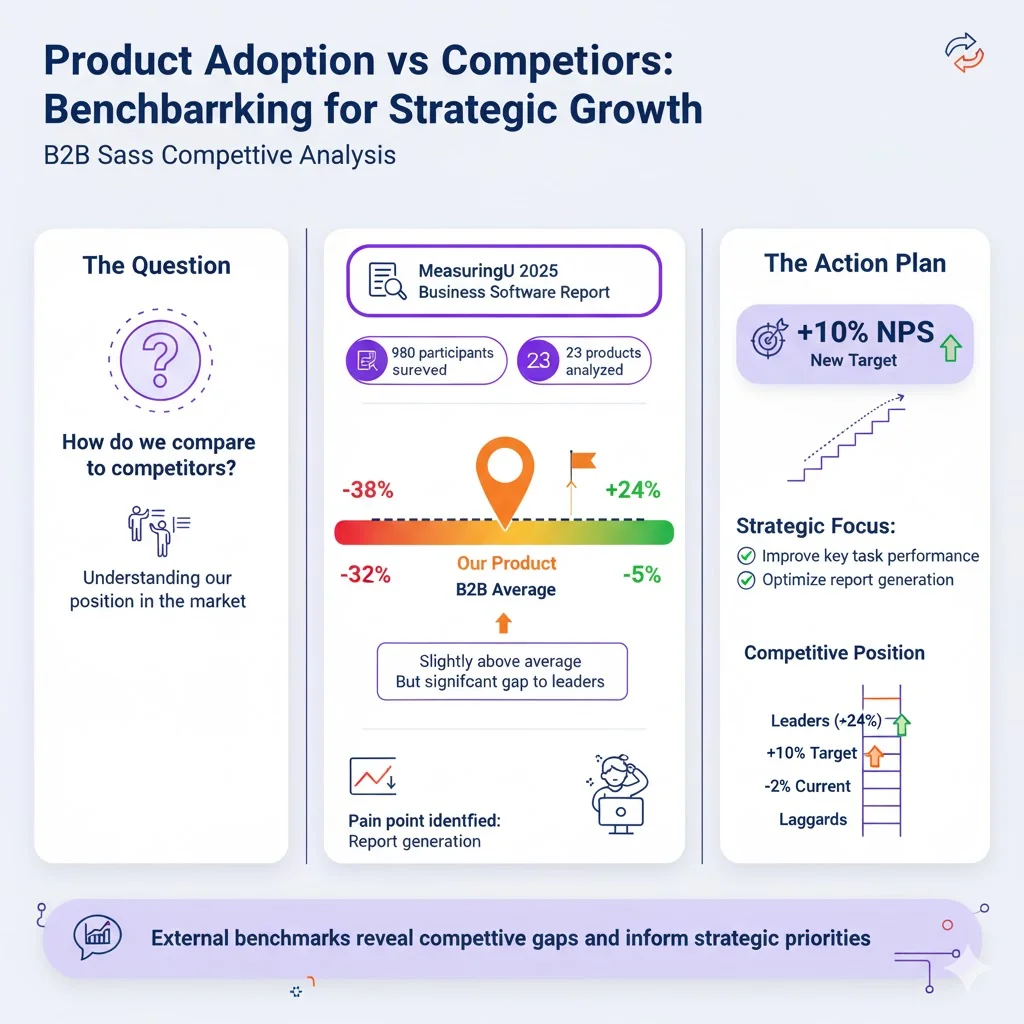
Product adoption vs competitors
A B2B SaaS firm wanted to understand how its adoption rate compared to rivals. We used an external NPS benchmark from MeasuringU. The 2025 business software report surveyed 980 participants across 23 products and found an average NPS of −5%, ranging from −38% to 24%. Our product’s NPS was −2%, placing it slightly above the B2B average but well below category leaders. The benchmark allowed us to set a target of +10%. We focused on improving performance for key tasks (e.g., generating reports), which our follow‑up study identified as a pain point.
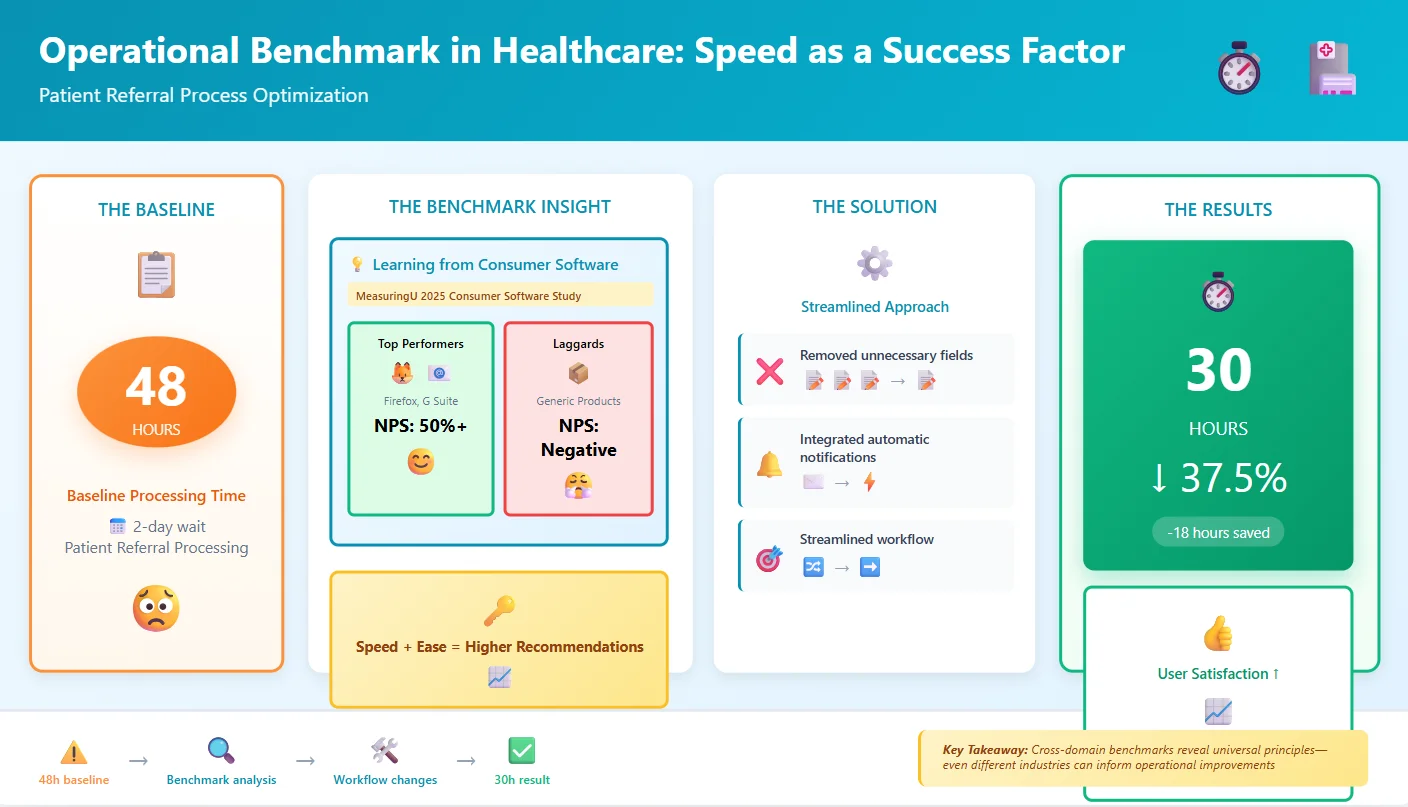
Operational benchmark in healthcare
In a healthcare application, the operations team measured the time to process a patient referral. Their baseline was 48 hours. They looked at benchmarks from similar systems in the consumer software space. MeasuringU’s 2025 consumer software study reported that top products like Firefox and Google G Suite achieved NPS scores above 50%, while some laggards scored negative. Although it was a different domain, the message was clear: speed and ease strongly influence recommendation. The team streamlined the referral workflow, removing unnecessary fields, and integrated automatic notifications. The result: processing time dropped to 30 hours and user satisfaction increased, as shown in follow‑up surveys.
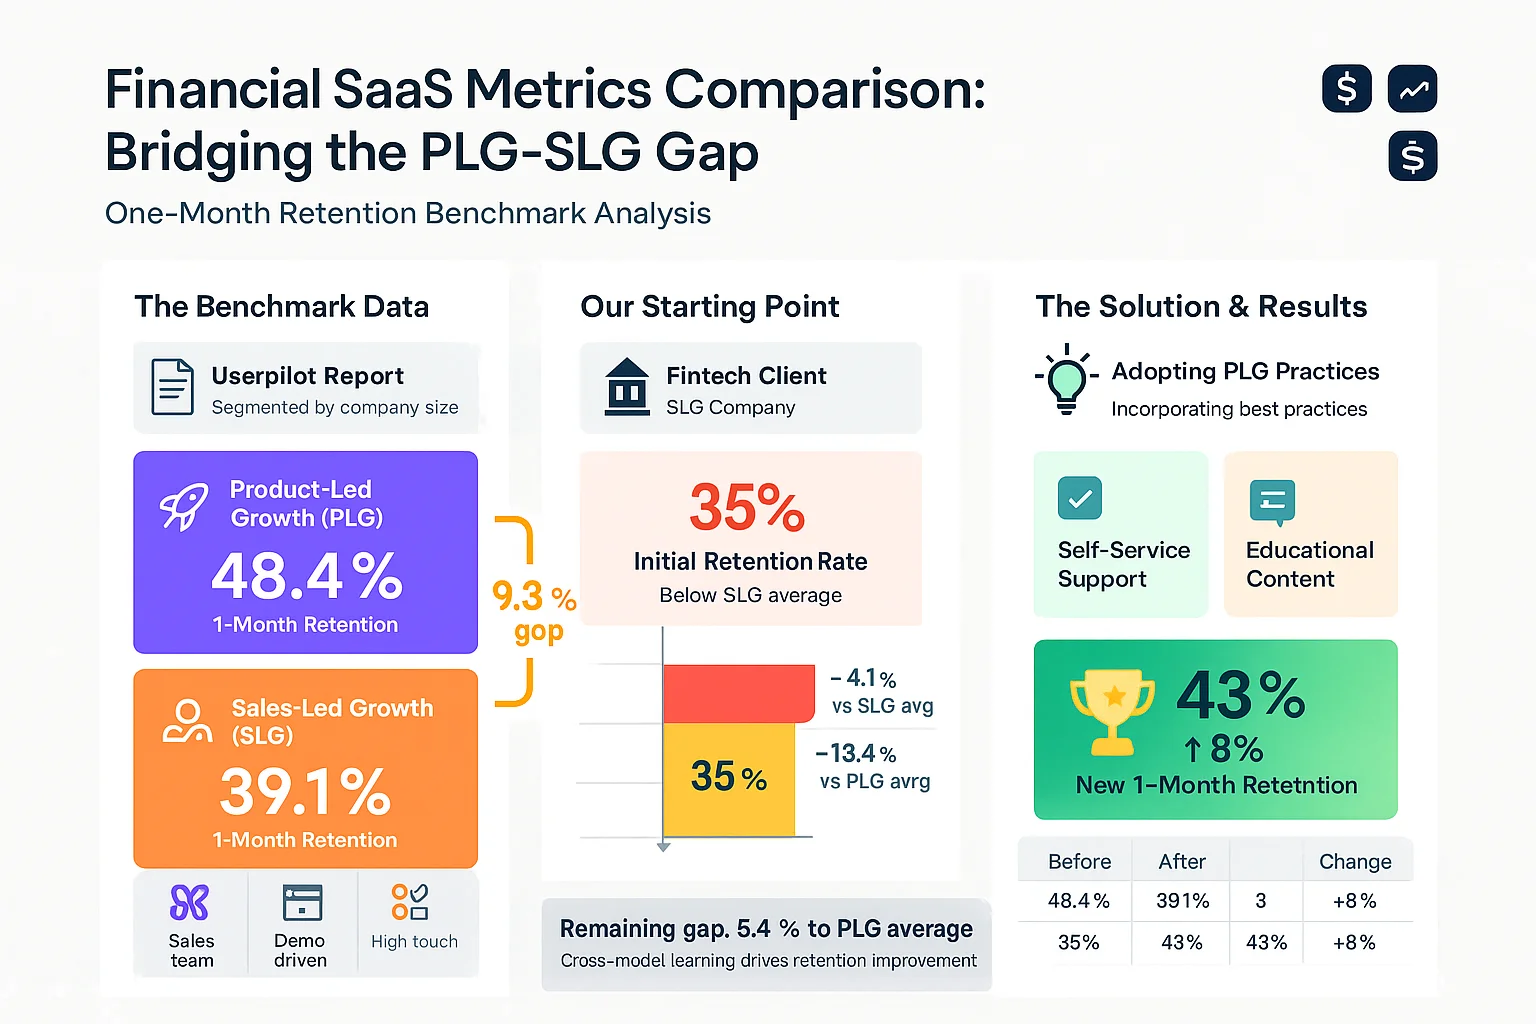
Financial SaaS metrics comparison
Userpilot’s report segmented data by company size and showed that Product‑Led Growth (PLG) companies had a one‑month retention rate of 48.4%, compared to 39.1% for Sales‑Led Growth (SLG) companies. Our fintech client, an SLG company, benchmarked its 35% retention against these figures. By incorporating PLG practices—self‑service support and educational content—the team raised retention to 43%, closing much of the gap.
These scenarios underline that what is a benchmark study is not an abstract academic question; it’s a practical tool for evaluating progress and guiding action.
How to get started
For early‑stage teams, benchmarking can feel daunting. Here’s how to begin without getting overwhelmed:
- Start small. Pick one critical flow or metric rather than trying to measure everything at once.
- Use available data. Public benchmark reports (like MeasuringU or Userpilot) provide reference points. Even if they don’t match your exact domain, they give ballpark targets.
- Leverage off‑the‑shelf tools. UserTesting, Maze and other platforms make it easy to run unmoderated usability tests and collect metrics. They often include benchmarks as part of their services.
- Combine methods. Benchmarking alone won’t tell you why metrics are high or low. Pair it with qualitative research or A/B testing.
- Iterate. Don’t wait for a perfect setup. Run a pilot, refine your metrics and methods, and run it again. Each iteration will refine your understanding.
- Tie to company goals. Align benchmarks with OKRs so that the work matters to everyone. When leadership sees a clear connection between metrics and outcomes, they’re more likely to support the effort.
Benefits, risks and return on investment
Expected benefits
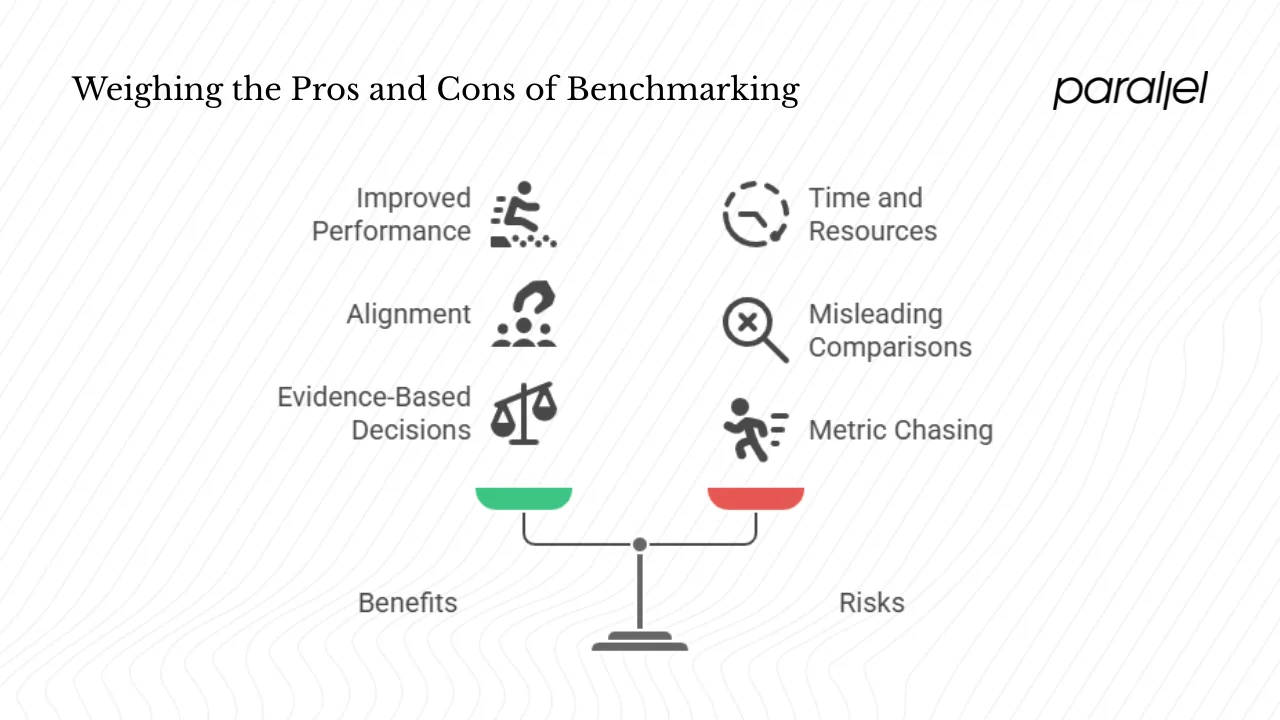
- Improved performance. Benchmarking identifies gaps and informs changes that enhance efficiency, usability and satisfaction.
- Alignment. Shared metrics create a common language across teams and help align product, design and engineering. They also make it easier to communicate progress to investors and stakeholders.
- Evidence‑based decisions. Benchmarking data backs up decisions, reducing reliance on opinion.
Risks and costs
- Time and resources. Planning, running and analysing studies require commitment. In small teams this can be a significant investment.
- Misleading comparisons. Benchmarks must be relevant. Comparing a niche enterprise product to consumer apps can lead to unrealistic goals.
- Metric chasing. Over‑emphasis on numbers can lead to local optimisations and lost focus on overall product vision.
Measuring ROI
To assess the return on your benchmarking effort, look at improvements in key metrics (e.g., conversion, retention, task completion time) relative to the cost of conducting studies. For example, if a benchmark study costing 50 hours of staff time resulted in an improvement in onboarding that increased monthly recurring revenue by 10%, the return is clear. Consider intangible benefits too: improved team alignment, greater customer satisfaction, and evidence for fundraising.
When benchmarking may not be worth it
Benchmarking is less useful when you lack a stable product or sufficient user base, or when metrics don’t align with strategic priorities. In very early concept stages, formative research methods like interviews and prototype tests are more valuable. Once the product has enough usage to generate reliable data, benchmarking becomes more meaningful.
Conclusion
If you were wondering what a benchmark study is, it’s a disciplined practice of measuring and comparing performance to make informed decisions. Benchmarking matters because it tells you whether changes actually help. It draws on baselines and external standards to identify gaps, set targets and track progress. By following the process outlined above—defining scope, selecting metrics, choosing comparators, collecting data, analysing results, implementing changes, and iterating—you can integrate benchmarking into your product and UX practice.
Our experience at Parallel shows that benchmark studies are not about chasing vanity metrics. They are about understanding your current performance, learning from others, and driving improvements that matter. With a thoughtful approach and a willingness to face the data, you can use benchmarking to build better products and experiences.
Frequently asked questions
1) What is the meaning of a benchmark study?
It’s a research method that measures your product or process against a predefined standard, baseline or industry best practice. It involves collecting quantitative metrics (e.g., task success, time on task, NPS) and comparing them over time or against peers to identify improvement areas.
2) What is a benchmark study in healthcare?
In healthcare, benchmark studies compare clinical or operational metrics against standards to improve patient outcomes and operational efficiency. For example, a hospital might measure average referral processing times and compare them to those of leading institutions. This highlights gaps and guides process improvements. Data privacy and ethical considerations are essential when handling patient information.
3) What is a benchmark example?
Suppose your SaaS platform’s trial conversion rate is 12% and you learn that the average among similar products is 20%. That external figure is your benchmark. It tells you there’s a gap to close. Another example comes from MeasuringU’s 2025 consumer software study: the average NPS across 40 products was 24%, with top performers like Firefox scoring 56%. Knowing where you stand relative to that benchmark guides your strategy.
4) What is a benchmarking study?
It’s another way of asking what a benchmark study is. The terms are interchangeable; both refer to structured evaluations that compare product or process performance against baselines and standards. A good benchmarking study is repeatable, uses well‑defined metrics and offers actionable insights.
5) How often should benchmarking be done?
It depends on your product cycle and resources. For many startups, conducting a benchmark after every major release or once per quarter strikes a balance between timely feedback and resource constraints. UserTesting notes that benchmark studies are typically run regularly (monthly, quarterly, or yearly).
6) How many participants are needed?
Benchmark studies require larger sample sizes than formative usability tests. UserTesting emphasises that factors such as whether you’re comparing products or just tracking one product over time affect sample size. In practice, aiming for at least 30 participants per condition provides more reliable quantitative data.
7) What tools support benchmarking?
Platforms like UserTesting, Maze, UserZoom, and analytics tools such as Amplitude or Mixpanel allow you to collect metrics consistently. Third‑party reports, such as MeasuringU’s industry benchmarks and Userpilot’s Product Metrics Benchmark Report, provide external context. The right tool depends on your budget, user base size and research maturity.

check out these related blogs


.avif)