Building a subscription business is a marathon, not a sprint. As founders and product leaders, one question looms large: what is churn in business, and why does it shape everything from growth plans to design decisions?
Churn is the percentage of customers or subscribers who stop doing business with you during a given period. When those numbers creep up, revenue growth slows and your product decisions begin to feel reactive rather than strategic.
This guide draws on work with early‑stage AI and SaaS teams and research from Recurly, Churnkey and Sprinklr to clarify what churn is, how to measure it, why it matters and how to address it.
What is churn in business?
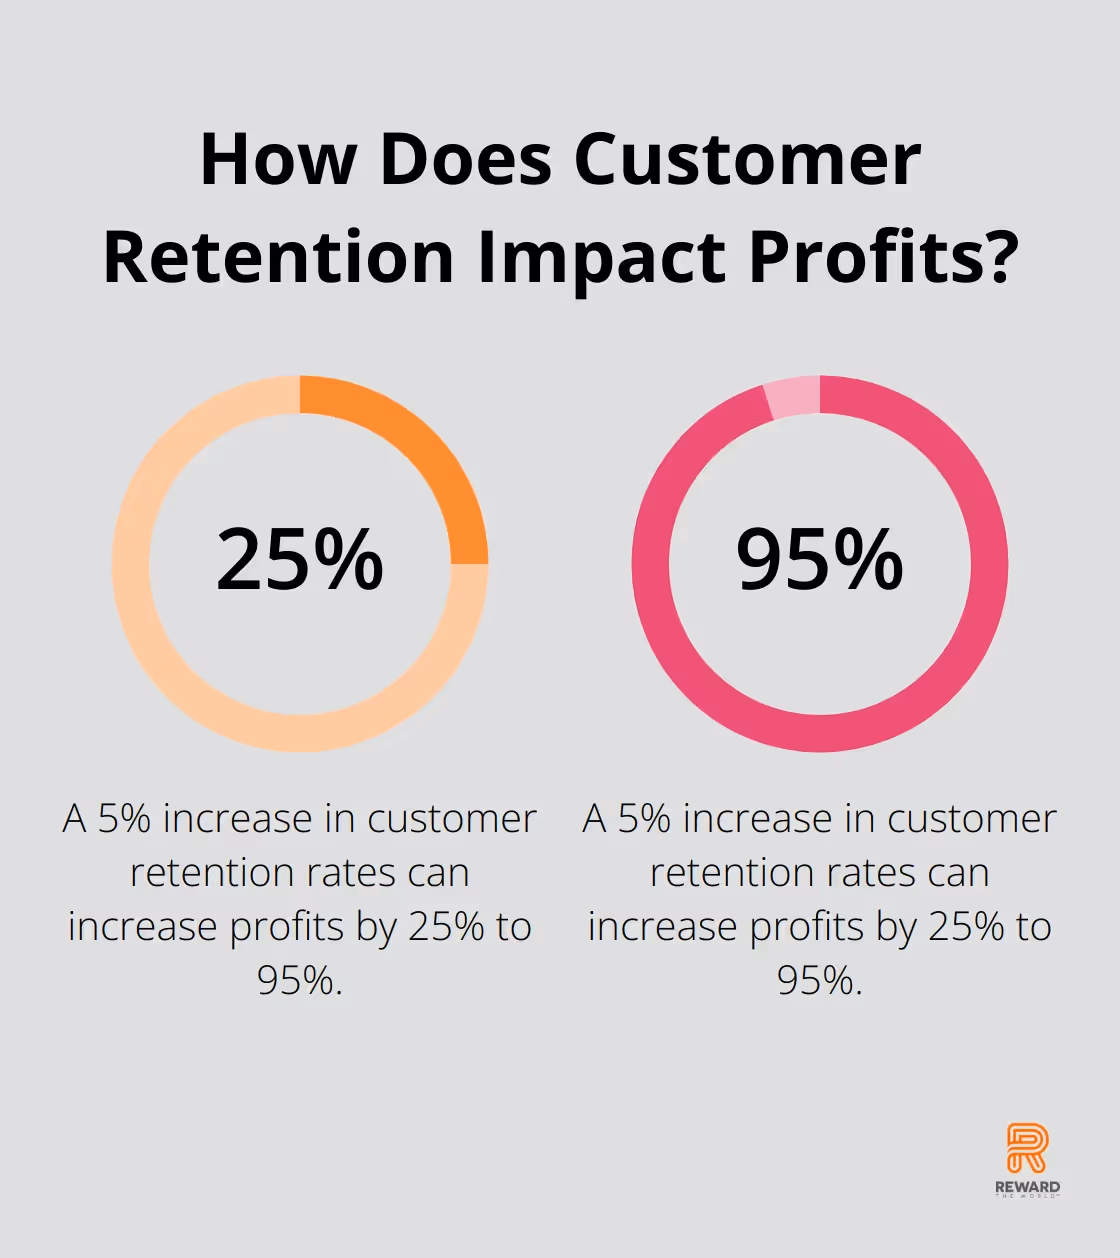
Churn is a polite word for losing customers. In subscription or recurring‑revenue models, it’s the customer attrition rate — the proportion of clients who sever their relationship with your business during a given period. Churn applies across consumer and business services. When the rate climbs, it exposes gaps in product‑market fit, onboarding and pricing. Retention research shows that increasing customer retention by just 5% can boost profits by 25%–95%, and loyal customers spend significantly more than new ones. Failing to stem churn means constantly paying to acquire new customers just to hold steady.
How churn is calculated
#1: Customer churn rate
Customer churn rate measures how many customers you lose relative to your base. The standard formula is:
Customer churn rate = (Customers lost ÷ Customers at the start of a period) × 100
For example, if you begin the month with 500 subscribers and 25 cancel, your churn rate is (25 ÷ 500) × 100 = 5%. Exclude newly acquired customers from the denominator; including fresh sign‑ups hides whether existing customers are staying or going. Userpilot’s 2025 churn guide illustrates this formula and emphasises the need to use a consistent start‑of‑period cohort. Clarifying the calculation demystifies what is churn in business for your team.
#2: Revenue churn rate
Not all customers contribute equally, so revenue churn measures the percentage of recurring revenue lost in a period due to cancellations and downgrades. Differentiating revenue churn from customer churn clarifies what is churn in business from a financial perspective:
Revenue churn rate = (Revenue lost ÷ Monthly Recurring Revenue at the start) × 100
If you lose €1 000 of €20 000 in monthly recurring revenue, that’s (1 000 ÷ 20 000) × 100 = 5% revenue churn. Userpilot’s guide notes that tracking revenue churn alongside customer churn offers a nuanced view and helps you spot whether you’re losing high‑value customers.
Revenue churn can remain high even if you lose only a few customers, because those customers might be your biggest spenders.
#3: Gross vs. net churn
Gross churn counts every customer or euro lost, while net churn subtracts expansion revenue from upgrades and cross‑sells. A 3% gross churn rate might equate to a 0% net churn rate if upsells offset the losses. Tracking both indicates whether account expansion is masking a leaky bucket.
Types of churn
Churn isn’t monolithic. Understanding what is churn in business means recognising the different causes so you can apply the right remedy.
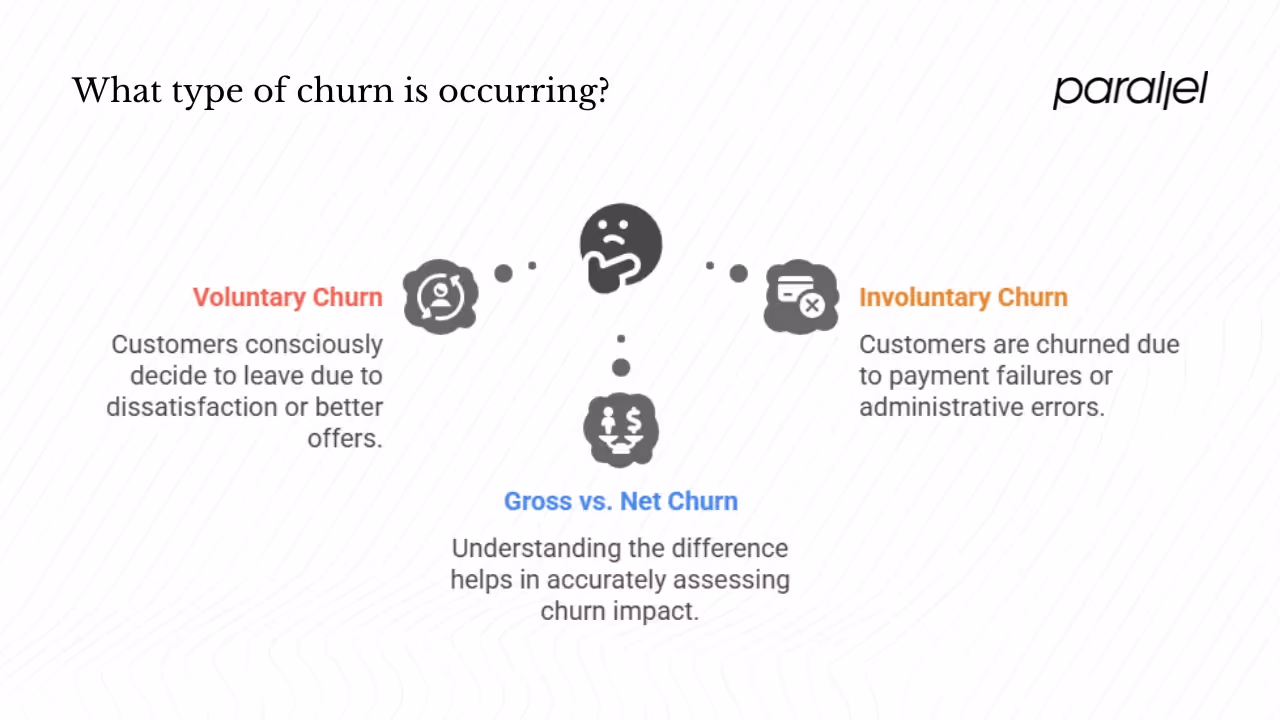
- Voluntary churn: Customers consciously decide to leave. Reasons include dissatisfaction with the product, a competitor’s offering, price sensitivity or changing needs. Recurly’s churn benchmark report distinguishes voluntary cancellations from involuntary churn and finds that the overall churn rate across subscription businesses averages 3.27%, with voluntary churn at 2.41%.
- Involuntary churn: Customers don’t intend to leave but get churned anyway — for example, due to expired credit cards, failed payments or administrative errors. Churnkey’s 2025 State of Retention report notes that involuntary churn can account for 40% of total churn and typically centers on payment failures. Differentiating voluntary and involuntary churn allows you to tackle each with the right tactics (product improvements vs. payment recovery).
- Gross vs. net churn: As mentioned, gross churn counts all lost customers or revenue, while net churn subtracts expansion. Net churn can sometimes mask a churn problem if a few high‑value upgrades compensate for many small losses.
Taken together, these categories show that churn isn’t a single phenomenon but a combination of voluntary exits, involuntary failures and the interplay between losses and expansions.
Why churn matters — business impact
1) Revenue loss and growth trajectory
High churn erodes recurring revenue and slows growth. Recurly finds that the median churn rate across subscription businesses is about 2.8%, yet sectors like digital media and consumer goods see churn around 6.5%recurly.com. Even a 5% monthly churn results in nearly a 46% annual losschurnkey.co. This compounding effect is why churn is often described as a growth ceiling.
2) Customer lifetime value and acquisition ROI
Higher churn shortens customer lifetime value (CLV), making customer acquisition costs harder to recoup. Sprinklr’s retention statistics show that acquiring a new customer costs five times more than retaining an existing one, and loyal customers spend 67% more. Managing churn therefore maximizes the return on your marketing and product investments.
3) Product and market signals
Churn is feedback. High voluntary churn often signals poor product–market fit, weak onboarding or lack of user education, while low churn reflects a healthy fit. A McKinsey‑referenced case study reported that a European energy provider reduced churn by 15% after improving the customer experience. Monitoring churn by cohort and pricing tier also shows whether competitors are luring customers away. These impacts illustrate why what is churn in business is not just a metric but a lens on your product and market.
Benchmarks & what’s considered “good” churn
“Good” churn depends on industry and business maturity. Use benchmark data as a guide, not gospel.
- Overall benchmarks: Recurly reports an overall subscription churn rate of 3.27%, with voluntary churn at 2.41% and involuntary at 0.86%. Subscription businesses often aim for monthly churn below 2% or annual churn below 10%.
- Early‑stage startups: Young SaaS companies often see higher churn — sometimes 10% or more per month — because they’re refining product–market fit. Treat high churn as a signal to revisit onboarding, support and pricing.
- Segment differences: B2C digital media and consumer goods experience higher churn (around 6.5%) compared with B2B software and professional services (around 3.8%). Larger enterprises with longer contracts see churn as low as 1%, while small and mid‑sized SaaS businesses typically sit between 3% and 7%.
Use these benchmarks to calibrate expectations about what is churn in business, but focus on trending your own churn rate down over time.
Drivers of churn
Understanding why customers leave is the first step toward reducing churn. Common drivers include:
- Product–market misfit: Your product may not solve a pressing problem or lacks critical features, so customers see little value.
- Onboarding and support gaps: Confusing set‑up flows, weak documentation or lack of proactive support prevent users from seeing early value.
- Pricing and billing frictions: Unexpected fees, inflexible plans or complex cancellations drive cancellations; Recurly notes that payment declines and lack of retention options are major contributors.
- Competition and customer fit: Competitors may lure users away, or some customers are simply the wrong fit for your stage and capabilities.
- Involuntary churn: Failed payments cause customers to churn without intending to; Churnkey reports that involuntary churn can represent up to 40% of total churn and recommends retry schedules and reminders.
These factors combine product, process and payment issues that undermine retention, giving you the human context for what is churn in business.
How to reduce churn
Reducing churn isn’t about a single silver bullet; it’s about orchestrating product, design, support and marketing efforts to create sustained value. Effective tactics include:
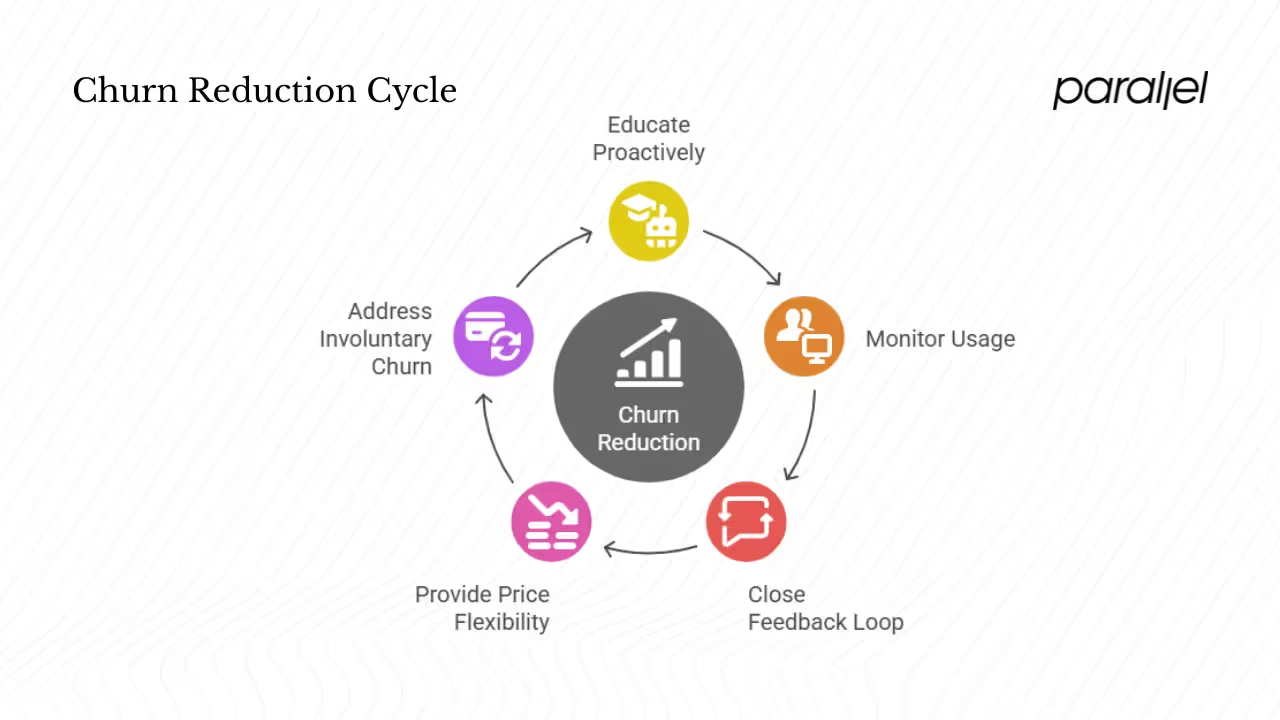
- Educate proactively: Design onboarding to lead users quickly to the “aha” moment, using guided tours, tooltips and tutorials so they grasp the value early.
- Monitor usage and intervene early: Track adoption and sign‑in frequency; if engagement drops, reach out before users churn. Health scores and alerts help teams focus their outreach.
- Close the feedback loop: When customers cancel, capture why through surveys and interviews. Analyse the patterns and feed them into your roadmap.
- Provide price flexibility: Offer downgrade or pause options instead of forcing customers to cancel. Recurly notes that features like pause functionality can push renewal invoice paid rates above 95%.
- Address involuntary churn: Adopt payment‑recovery tools like automatic card updates and retry schedules. Churnkey’s research shows that involuntary churn often stems from soft card declines; automated reminders and retries recover revenue with minimal friction. Running targeted win‑back campaigns on lapsed users can also support retention.
Measuring success around churn
Measure retention efforts with a simple dashboard tracking customer churn, revenue churn, net revenue retention and customer lifetime value. Analyse churn by cohort (e.g., signup month or pricing tier) to spot patterns, and compare metrics before and after product or pricing changes.
Pair numbers with stories from exit surveys, usage data and customer interviews so that designers, marketers, engineers and finance teams understand the human reasons behind churn and adjust their work accordingly. Churn metrics often provide the only shared language across diverse functions; treating them as such ensures everyone is accountable for improving the customer experience and growing sustainably.
Conclusion
Churn isn’t just a number on a dashboard; it’s a signal that tells you how well you’re serving customers and pricing your value. Early‑stage teams sometimes dismiss churn as inevitable, but doing so only increases acquisition costs. Use churn metrics to ask hard questions about product fit, onboarding and pricing, then act quickly. If you treat what is churn in business as your compass, you’ll make better decisions and build a business that compounds value.
As you refine your product, remember that healthy retention comes from serving the right people at the right time. Don’t chase growth for its own sake; be intentional about who you bring on board and honest about whether they’re likely to succeed with your product. Reflect on churn regularly and treat it as an opportunity to learn rather than an embarrassment to hide.
Frequently asked questions
1) What does a 5% churn rate mean?
A 5% monthly churn rate means you lose five out of every hundred customers (or euros of recurring revenue) each month. Even seemingly small churn compounds rapidly; Churnkey notes that 5% monthly churn results in losing about 46% of customers annually.
2) What is an example of churn?
If a SaaS business has 1 000 customers and 100 cancel in a month, that’s a 10% customer churn rate. Likewise, if you have €10 000 in monthly recurring revenue and lose €1 000 through downgrades or cancellations, that’s 10% revenue churn. The formula is consistent: lost customers (or revenue) divided by starting customers (or revenue) multiplied by 100.
3) What is a good churn rate?
Benchmarks vary, but subscription businesses often aim for less than 2% monthly churn or under 10% annual churn. High‑performing SaaS companies keep annual churn around 5%. Early‑stage startups may see higher churn until they achieve product‑market fit, but the goal is to see churn trending downward over time.
4) How is churn calculated?
Customer churn rate is calculated as (Customers lost ÷ Customers at the start of the period) × 100. Revenue churn uses the same logic but substitutes revenue for customer count: (Revenue lost ÷ Revenue at the start) × 100. Excluding new customers from the base prevents skewed results.

check out these related blogs