Founders and product teams at early‑stage startups often focus on shipping features and growing their audience. What many overlook is how people travel from discovering your product to taking an action that matters. That’s where the concept of what is a conversion funnel in web analytics comes in. In simple terms, a conversion funnel is a model of the steps a person takes on your website or app before they complete an action—signing up, purchasing or subscribing. Knowing your funnel helps you see where visitors drop off and where they move forward, allowing you to improve experiences and grow more efficiently.
In this article, I’ll explain what a conversion funnel is, why it matters for start‑ups, and how to map and analyse one. I’ll draw from my own experience at Parallel working with early‑stage AI/SaaS teams, as well as insights from analytics providers like Amplitude, Matomo and Statsig. You’ll learn common mistakes, practical tips for improvement, and how to choose tools that suit your needs. The primary audience includes founders, product managers and design leads who need clear, actionable guidance. By the end, you’ll have a solid understanding of conversion funnels and will be ready to run your own experiments.
What a conversion funnel means in web analytics
A conversion funnel is essentially a way to map the path a user follows through your site or app toward a desired outcome. Amplitude describes it as showing how users go from first discovering your product to completing a desired action. Crystallize explains that the model represents the customer path from initial awareness to an action such as purchase or subscription. The metaphor of a funnel shows clearly that many people enter at the top, but fewer continue as they progress toward the bottom. Each stage narrows because people drop off at different points.
When we talk about conversion funnels in web analytics, we’re not just referring to broad marketing concepts. We mean tracking specific events—page views, button clicks and people submitting information—within your product. Matomo’s 2024 guide defines funnel analysis as a marketing method to analyse the events leading to specific conversion points. By tying individual user actions to stages in your funnel, you can see where friction occurs and which parts are performing well. In my work with early‑stage SaaS teams, mapping these events has helped pinpoint where onboarding flows confuse users or where sign‑up pages are abandoned. If you still wonder what is a conversion funnel in web analytics, think of it as the bridge between your analytics data and the user behaviours you need to improve.
Why this matters for startups and product/design leads
Early‑stage startups often need to grow quickly with limited resources. Understanding the conversion funnel lets founders and product managers focus on the right changes. Amplitude explains that optimizing your funnel can lower acquisition costs, boost lifetime value and create a better user experience. In other words, getting more out of existing traffic is less costly than constantly buying new users.
From a design perspective, conversion funnels show where the user path is confusing or frustrating. If you’re a product or design lead, you can use funnel analysis to identify drop‑off points, test different interface patterns and refine the onboarding flow. When we worked with a SaaS client offering a free trial, the funnel showed that most drop‑offs happened during the sign‑up page. By simplifying the sign‑up step and adding progress indicators, we cut abandonment by 30% and improved trial sign‑ups significantly.
Important concepts and terms
When talking about conversion funnels, a few concepts keep coming up:
- Sales process & customer path – your funnel sits within the larger process of turning interest into revenue. It’s about how a potential customer moves from awareness to purchase and, ideally, loyalty.
- User path or visitor flow – the sequence of pages or actions a person follows. Web analytics tools often provide diagrams showing common paths and where users diverge.
- Stages of conversion – typical stages include awareness, interest, consideration, and action. These can be adapted to your business model. For example, SaaS products may define stages such as visit, sign‑up, trial activation and paid upgrade.
- Funnel visualisation – analytics tools often display funnel data as a bar or pyramid, showing drop‑off numbers between steps. Being able to see where people leave makes the problem tangible.
- Marketing funnel vs. product funnel – marketing funnels often measure broad awareness and lead nurturing, while product funnels track in‑app events. For a holistic view, connect these two so that marketing efforts support product engagement.
- Lead nurturing – if your product has a sales cycle, nurturing leads across funnel stages can involve emails, onboarding calls or in‑product cues. Statsig points out that personalising onboarding and streamlining the checkout process can keep users engaged.
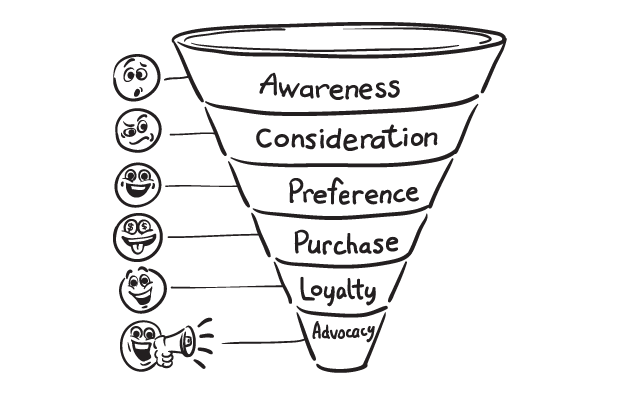
Typical stages of a conversion funnel
A conversion funnel can vary by business model, but the common pattern looks like this:
- Awareness/Discovery – users land on your site or hear about you through ads, search or word of mouth. The Crystallize definition calls this the stage where potential customers become aware through marketing or social channels. In web analytics, you might track page views or unique visitors.
- Interest/Engagement – users browse content, view product pages, or read blog posts. Their behaviour shows curiosity. Events to track include page depth, time on site and interactions (e.g., clicking “Learn more”).
- Consideration – visitors evaluate whether your product fits their needs. They may compare features, read reviews or add items to their cart. Crystallize suggests that companies can influence this stage by providing persuasive content and targeted offers.
- Intent/Conversion – the moment when a user begins the sign‑up flow, enters their details or proceeds to checkout. This is where friction matters most: extra fields or confusing steps can drive drop‑offs.
- Action – the user completes the desired step (purchase, sign‑up, subscription). According to Amplitude, this stage should be obstacle‑free because each extra step increases abandonment risk.
- Retention/Advocacy (optional but important) – post‑conversion, the goal is to keep users engaged and turn them into repeat buyers. Amplitude emphasises that satisfied customers can become advocates and drive referrals.
These stages can be adapted for different business types:
- SaaS: Visitor → sign‑up → trial → upgrade.
- E‑commerce: Visitor → product view → add to cart → checkout → purchase.
- Content platforms: Visitor → article read → sign‑up for newsletter → paid subscription.
Each stage will have a drop‑off. The Amra & Elma statistics show that around 79% of users leave during the awareness stage, about 50% leave at the interest stage, 25% leave during consideration, and 10–15% abandon during the decision stage. For retention, roughly 40% of customers churn within the first year. These numbers, while general, demonstrate why focusing on each step is vital.
Mapping and visualising your funnel
Many founders only realise what is a conversion funnel in web analytics once they start mapping it. Mapping a conversion funnel means translating each stage into measurable events and then visualising drop‑offs. The process typically involves:
- Define your stages – based on your product model. For a SaaS app, the first step might be landing on the home page; the second could be clicking “Get started”; the third is completing sign‑up.
- Map stages to events/pages – decide which events or pages represent each stage. Events could be page views (e.g., /pricing), button clicks (e.g., “Start Trial”), or custom events (e.g., trial_activated).
- Set up tracking – implement analytics (e.g., Amplitude, Matomo, Statsig) to capture these events. Make sure your event names are consistent. Matomo warns that you must analyse all events leading to the conversion point to understand the funnel.
- Visualise the funnel – use your tool’s funnel report to see conversion rates between steps. Amplitude’s funnel visualisation shows the path narrowing from awareness to action. Statsig’s documentation explains how their funnel charts compute drop‑off by dividing the number of users who didn’t complete a step by the total number who started.
- Define time windows – decide how long you’re giving users to move from one stage to the next. This can prevent misinterpreting delays as drop‑offs.
- Consider non‑linear paths – not every user follows the exact sequence. People may skip steps, return later or repeat steps. Tools like session replays or path analytics help you see alternative flows.

When visualising your funnel, keep the number of steps manageable—three to five is often plenty. Too many steps can make the funnel complicated and inflate drop‑off rates. During a project with an AI startup, we initially tracked ten onboarding steps. The funnel chart looked like a sand timer and did little to guide improvements. Consolidating steps by grouping related actions gave clearer insights.
What funnel analysis reveals
If you’re still unclear what is a conversion funnel in web analytics, analysing one will make it obvious. Analysing the conversion funnel uncovers specific patterns:
- Drop‑off points – the stages where users abandon the process. Amplitude points out that each stage is an opportunity to identify abandonment. Statsig describes drop‑off measurement as the difference between users starting and completing a step.
- Behavioural patterns – by analysing session recordings and heatmaps, you can see what users do instead of the desired action. Statsig suggests watching for repeated clicks, repeated attempts to enter details or bouncing between pages. These cues hint at confusion.
- Conversion rates between steps – conversion percentages show how efficiently users move from one stage to the next. For example, a sign‑up page with a 30% conversion rate might be acceptable, but if only 5% of users upgrade from free trial to paid, that stage needs work.
- Segmentation insights – break down funnel performance by user cohort, acquisition channel, device or geolocation. You may find that mobile users drop off during checkout because the checkout page isn’t optimised for small screens. Our team once discovered that a client's funnel drop‑off was much higher for Android users; the issue was a bug in the Android version of the app.
- Hypothesis generation – funnel analysis doesn’t automatically fix issues. It generates hypotheses. If drop‑off spikes at a step, ask why: is the copy unclear? Are you asking for too much information? Then test solutions.
For founders and PMs, connecting funnel metrics to business goals helps get teams on the same page. If your goal is to increase monthly recurring revenue, you might define a funnel from “visit pricing page” to “upgrade to paid” and track monthly conversions. For design leads, funnel insights validate or challenge assumptions about user flows.
Common mistakes and pitfalls
During my work with early‑stage teams, I’ve seen several mistakes that limit the value of funnel analysis:
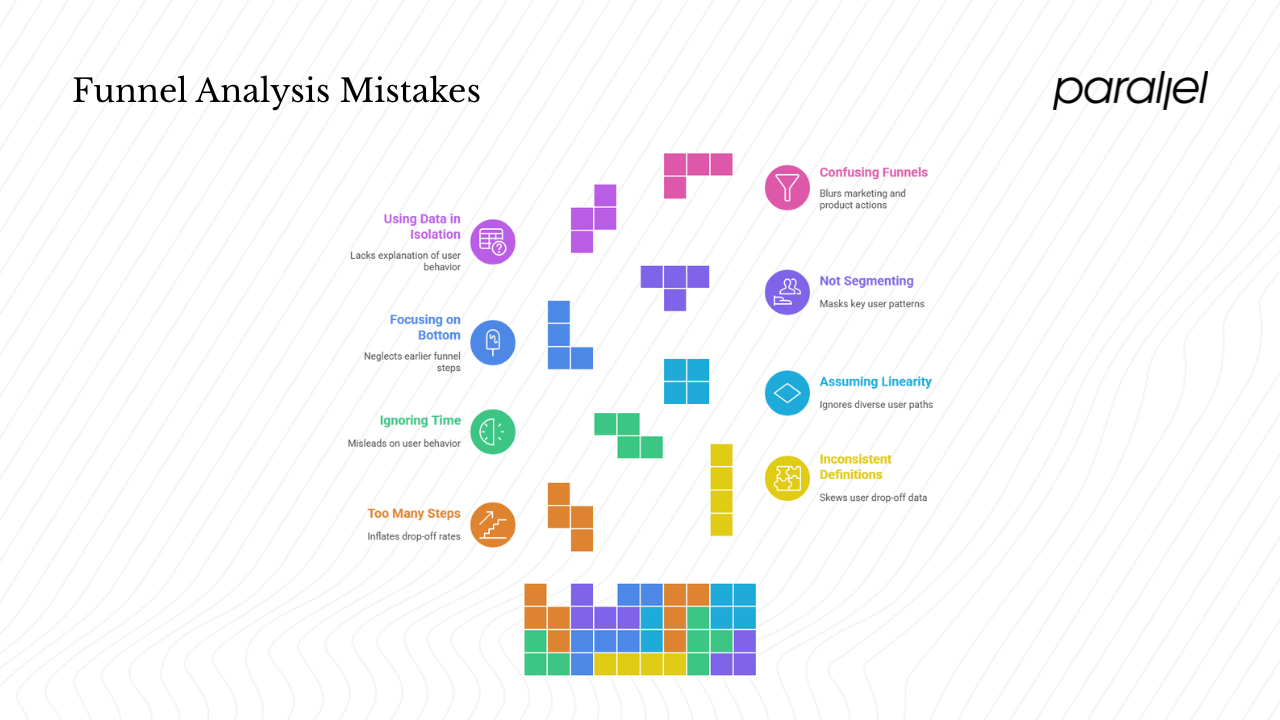
- Too many steps – people often track every minor action. This inflates drop‑off rates and distracts from the big picture. Start with the critical three to five steps.
- Inconsistent event definitions – if your “sign‑up” event is triggered on both clicking “sign up” and finishing the sign‑up step, you won’t know where users actually drop off. Keep definitions consistent.
- Ignoring time – some users take days to move through a funnel (particularly for B2B products). If you consider any delay as a drop‑off, your data will mislead you.
- Assuming linearity – not every user enters the funnel at the top. People may land directly on a product page or come from a referral link. Designing your funnel as a single path ignores these realities.
- Focusing only on the bottom – businesses often fixate on increasing final conversions but neglect earlier steps. Yet improvements in awareness or interest can significantly improve downstream metrics.
- Not segmenting – treating all users the same masks patterns. A channel might deliver high‑intent leads who convert well, while another brings visitors who browse and leave.
- Using funnel data in isolation – numbers don’t explain why. Pair quantitative data with qualitative methods: surveys, usability tests, or interviews.
- Confusing marketing and product funnels – clarify what you’re measuring. A marketing funnel may track ad impressions and email opens, whereas a product funnel tracks actions inside the app. Make definitions match your business objectives.
Optimising your conversion funnel: practical tips
Improving a funnel is iterative. Once you understand what a conversion funnel is in web analytics, you can take concrete steps to improve it. Here are strategies I’ve found effective:
- Map your current funnel and establish baselines – know your existing conversion rates at each stage before making changes.
- Identify the biggest drop‑off – prioritise the stage with the largest number of users leaving. This is usually the easiest place to find quick wins.
- Run experiments – use A/B testing or controlled experiments. Statsig emphasises that funnel metrics support experiments by measuring how people move through multi‑step flows and calculating drop‑off. Try variations of your landing page, sign‑up flow or pricing to see which reduces friction.
- Improve the path – simplify steps and reduce friction. Remove unnecessary fields, shorten copy and provide clear calls to action. In one project we replaced a multi‑page sign‑up process with a single screen and progress bar, which raised completion rates.
- Guide product design toward next steps – ensure that the design naturally leads users to the next action. If someone lands on a blog post, include a gentle prompt to try your product rather than leaving them to wander.
- Segment and personalise – analyze by device, channel or user persona. If mobile drop‑off is high at checkout, implement a simpler payment flow for smaller screens.
- Monitor over time – track changes weekly or monthly. A sudden drop could signal a bug or a recent change that hurt conversion.
- Don’t neglect retention – conversion is only the first step. Develop a post‑conversion funnel: onboarding, training, upsell and engagement. Amplitude points out that thoughtful onboarding and personalised follow‑ups turn one‑time buyers into loyal customers.
- Integrate marketing and product efforts – marketing campaigns should bring in users who are likely to convert. Keep messaging consistent so that expectations set in ads match what the product delivers.
A process we follow at Parallel
- Audit your funnel – run a funnel report in your analytics tool. Look for the biggest percentage drop. Ask: Is the copy unclear? Are we asking for too much information? Are users expecting something else at this step?
- Talk to users – complement data with user interviews or session recordings. Ask those who dropped off what stopped them.
- Propose hypotheses – for each friction point, come up with one or two solutions. For example, if a trial sign‑up asks for credit card details up front and this creates friction, test removing that requirement.
- Experiment – run an A/B test with your new variation. Use funnel analysis to measure if drop‑off decreases. Statsig’s analytics suite can compute drop‑off and surface improvements.
- Review and iterate – not every change will improve metrics, but the process itself will reveal patterns and lead to deeper understanding.
Real‑world examples and use cases
Consider a SaaS product offering a free trial. These real‑world examples illustrate what is a conversion funnel in web analytics in practice:
- Visitor lands on the marketing site
- Clicks “Start trial”
- Completes sign‑up step
- Activates product (e.g., integrates with their data)
- Upgrades to paid plan

In a recent engagement, we saw a steep drop between steps 3 and 4. Interviews revealed that users were confused about the integration step. By adding an in‑app guided tour and clarifying the value of integration, we improved activation by 22% within a week.
For an e‑commerce start‑up, the funnel may look like this:
- Visitor views home page
- Browses product pages
- Adds product to cart
- Proceeds to checkout
- Completes purchase
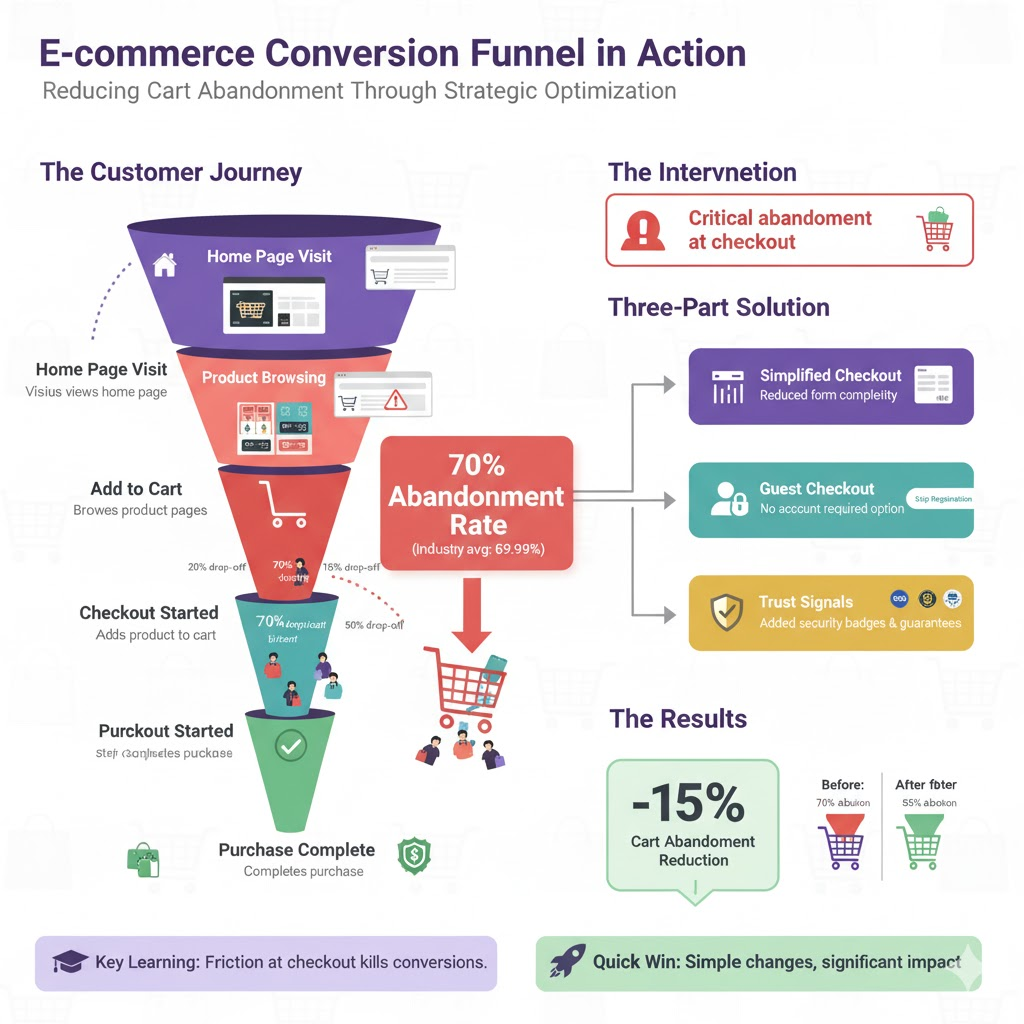
We’ve worked with a web store where cart abandonment was 70%, close to the average e‑commerce rate of ~69.99%. By simplifying the checkout page, offering guest checkout and adding trust signals, we reduced abandonment by 15%.
A mobile app might define a funnel as:
- Install the app
- Complete onboarding tutorial
- Perform first important action (e.g., upload photo)
- Subscribe or make in‑app purchase
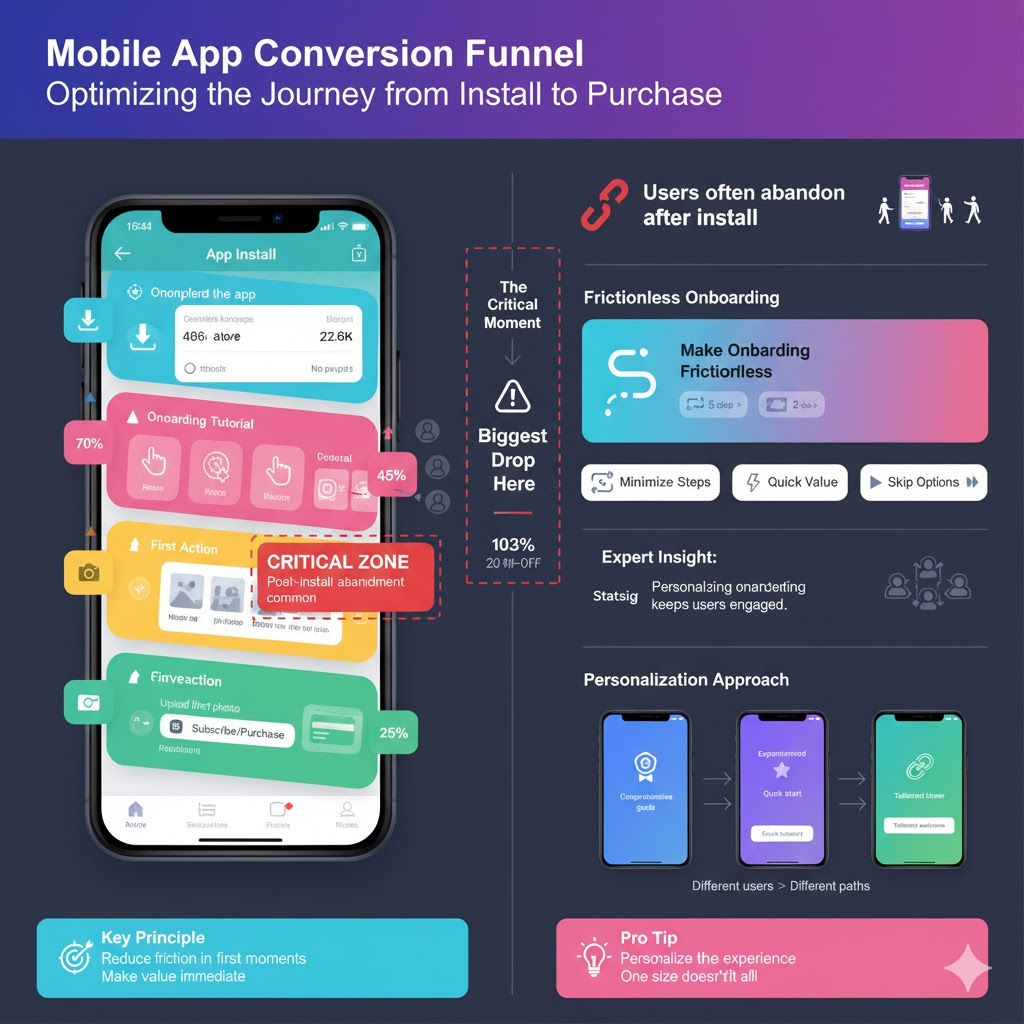
Because mobile users often drop off after installation, focus on making onboarding frictionless. Statsig suggests personalising the onboarding process to keep users engaged.
Metrics and KPIs to watch
As part of learning about conversion funnels in web analytics, you need to know which metrics matter. Several metrics help evaluate your funnel:
| Metric | Purpose | Example / comment |
|---|---|---|
| Overall conversion rate | Percentage of users who complete the desired action out of those who entered the funnel. | An e-commerce site may have an overall conversion rate of 2.35%, with top performers at 5–7%. |
| Step-to-step conversion | Measures the proportion of users who move from one step to the next. | If 1,000 people start sign-up and 300 finish, the conversion rate for that step is 30%. |
| Drop-off rate | Calculated by dividing the number who abandon a step by those who started. | Statsig’s funnel charts compute drop-off automatically. |
| Time to convert | How long users take from the first step to conversion. | Long delays can indicate complexity or lack of urgency. |
| Channel/source comparison | Conversion rates by traffic source. | You may find that email leads convert twice as well as social media leads, guiding budget decisions. |
| Cohort conversion | Tracks conversion rates for different user cohorts (e.g., new vs. returning). | Useful for retention analysis. |
| Business metrics | Tie funnel performance to revenue or subscription metrics. | Trials-to-paid conversion or average order value is more meaningful to the business. |
Tools and platforms to support funnel analysis
The first step to answering what is a conversion funnel in web analytics is choosing a platform that can show it to you. Several analytics platforms help you map and analyse your conversion funnel. Each has strengths and trade‑offs:
- Amplitude – an in‑depth product analytics platform. It allows you to hold event properties constant, inspect user paths, and experiment with funnel definitions. Its funnel reports clearly show the path narrowing from awareness to action and provide segmentation by user cohort.
- Statsig – originally built for experimentation, Statsig offers funnel metrics and session‑wide tracking. Its documentation explains how to define multi‑step funnels and automatically compute drop‑off. Statsig integrates experimentation and analytics, making it useful for A/B testing.
- Matomo – an open‑source web analytics platform with a funnel feature. Its 2024 guide emphasises analysing the events leading to conversion points and highlights features such as heatmaps and session recordings. Matomo is a good option for organisations that value data ownership.
- Other tools – Mixpanel, Heap and Google Analytics also provide funnel reports. Choose a platform based on your budget, data volume, privacy requirements and need for product vs. marketing insights. When selecting a tool, ensure you can track custom events, make event definitions consistent with your goals and provide stakeholders with access to the data.
Conclusion
Understanding what is a conversion funnel in web analytics helps you make sense of user paths and focus on improvements that matter. A conversion funnel shows how visitors progress from awareness to a desired action, and mapping it in web analytics reveals where and why people drop off. For early‑stage startups and product teams, this knowledge translates into more effective design and product decisions, lower acquisition costs, and faster growth. By defining your funnel stages, tracking events carefully, and using tools like Amplitude, Statsig or Matomo, you can visualise drop‑off points and test changes that improve conversion. Keep your funnel simple, segment your users, and combine quantitative data with qualitative insight. The process isn’t about chasing vanity metrics; it’s about creating a clear, focused path that guides users to value and helps your business thrive.
Frequently asked questions
1) What is a conversion funnel?
A conversion funnel is a model representing how a user moves through a series of steps toward a desired action, such as signing up or purchasing. It visualises the path from awareness to action and highlights drop‑off points.
2) What is the conversion funnel for a website?
For a website, the funnel typically includes: landing on a page, engaging with content, starting a sign‑up or checkout, and completing the action. For example, an e‑commerce funnel might be the home page → product view → add to cart → checkout → purchase. Each step maps to specific events in your analytics tool and reveals where people leave.
3) Why analyse the conversion funnel?
Funnel analysis helps you see where users drop off and why. Matomo explains that funnel analysis assesses events leading to conversion points, and Amplitude explains that optimising your funnel improves revenue and reduces acquisition costs. By understanding your funnel, you can prioritise improvements and design experiments that increase conversion.
4) What are the stages of a conversion funnel?
Common stages include awareness, interest, consideration, intent/action and retention. However, the exact steps should be defined based on your product and goals. Each stage corresponds to user events you can track and analyse.
5) How often should I revisit my funnel?
Regularly. User behaviour changes as you introduce new features, run campaigns or adjust pricing. Monitoring your funnel over time helps you spot unexpected drops or gains and ensures that your product continues to guide users smoothly towards value.

check out these related blogs


.avif)


.webp)