Traffic alone doesn’t pay the bills. Many early‑stage startups spend aggressively on ads and content, see their dashboards light up, yet struggle to convert those visitors into customers. Designers polish interfaces and marketers craft campaigns, but sign‑ups remain stubbornly low. Guessing which tweak will fix things is a gamble. Understanding what funnel analysis is will change that. A well‑constructed funnel shows how many people make it through each step of your user flow and where they drop out. By tracking conversions and spotting leaks you can stop chasing vanity metrics and focus on the moments that matter. In this guide you’ll learn what a funnel is, why it’s valuable, how to build one, what tools to use and how to apply it to your product or service.
What is funnel analysis?
A funnel analysis is understanding the steps required for a user to reach an outcome and seeing how many make each step. It’s called a funnel because many people start at the top and progressively fewer reach the bottom. Each stage in that path can be a macro conversion or a micro conversion. Macro conversions are the major outcomes tied to business value — a purchase, a subscription, a completed order. Micro conversions are the small behaviours that signal interest: clicking a call‑to‑action, watching a demo video or adding an item to a basket.
HubSpot points out that micro conversions are incremental steps showing early interest in your brand. Examples include signing up for a newsletter, sharing an article or viewing multiple pages. Tracking both micro and macro conversions gives you a complete picture of how visitors progress.

The metaphor works because of its shape. Wide at the top, representing awareness, it narrows at each stage as people drop off. That drop‑off isn’t inherently bad; it’s natural that not everyone who views a page will become a paying customer. What matters is understanding the size and cause of those losses so you can make informed changes. Throughout this article you’ll see the phrase what is funnel analysis used to anchor these ideas.
Why funnel analysis matters (for startups and product teams)
Still wondering what funnel analysis is? A good funnel gives you numbers instead of gut feelings. It reveals where people exit: in an ecommerce example half of visitors never add anything to a basket. In SaaS, only 60 of 100 free‑trial sign‑ups reach activation and 18 pay. Benchmarks from 2025 report that roughly 79% of users drop off at the awareness stage, about half leave in the middle and only 10–15% abandon right before purchase. In B2B funnels the losses are even larger: 85–90% drop from leads to marketing qualified leads and 70–80% from MQLs to sales qualified leads. Funnels also bring product, design and marketing teams together because everyone can see the same data. They apply outside of checkout by tracking onboarding, feature adoption, content consumption and lead generation. For early‑stage founders and PMs this turns complaints like “no one is converting” into specific problems — such as a 40% drop between sign‑up and activation — and guides experiments.
Core components of a good funnel analysis
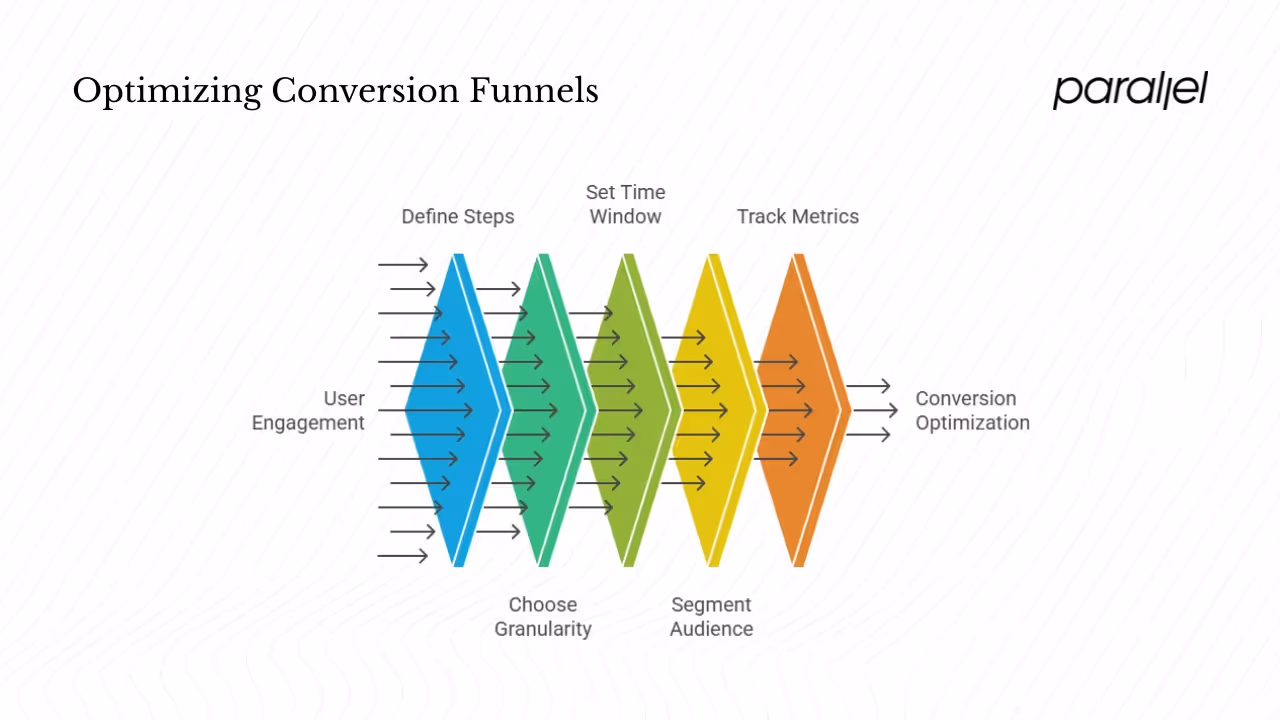
1) Define the steps
Choose events that represent meaningful progress. In a simple ecommerce flow you might track: visit → product view → add to basket → checkout → purchase. A SaaS onboarding flow could be: visit → sign‑up → welcome email opened → first feature used → subscription. Capture both micro and macro conversions.
2) Choose the right granularity
If your steps are too broad, you’ll miss hidden friction. Chartio suggests breaking the flow into smaller steps when a big drop occurs between two stages. Between “visit” and “add to basket” there might be search results, product page views and item details. Partial funnels for each sub‑step help you find the precise bottleneck.
3) Set a time window
Decide how long you’ll wait for someone to progress. For consumer products you might look at hours or days; for enterprise sales you might allow weeks or months. The conversion window affects how you interpret your funnel.
4) Segment your audience
Comparing funnels by cohort reveals patterns. Chartio’s tutorial recommends contrasting first‑time visitors with returning visitors. You can also segment by device (mobile vs desktop), geography, traffic source (organic vs paid) or user type (trial vs paying). Segmentation helps you adapt improvements to the group that needs them most.
5) Track core metrics
Focus on a handful of simple measures: what fraction of users move to the next step, how many leave between stages, how long it takes to progress, and how cohorts differ. These values — conversion rates, drop‑off rates, time to convert and funnel throughput — provide the foundation for your analysis.
Common funnel types and examples
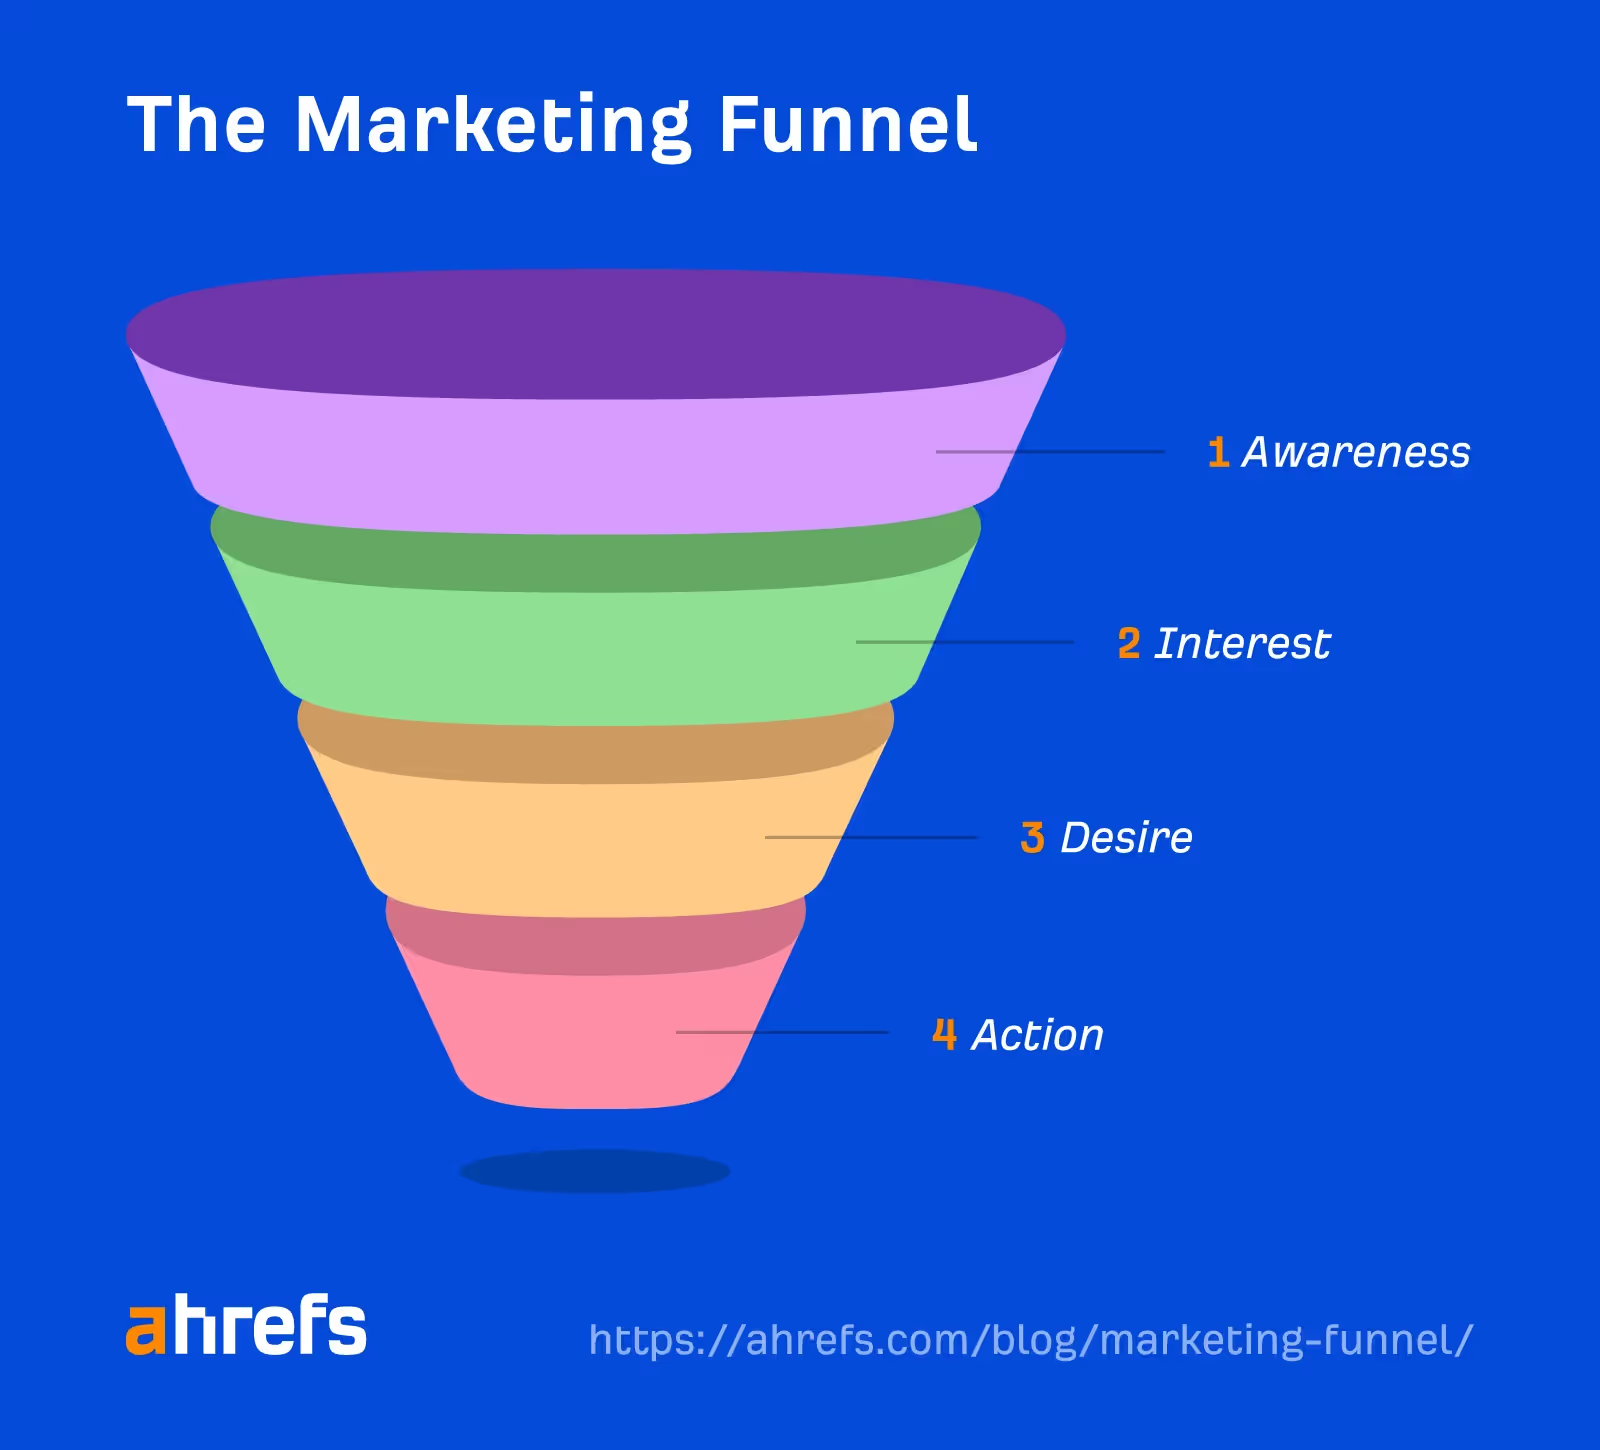
1) Marketing funnels: Marketing funnels follow three stages: awareness, consideration and decision. Benchmarks from 2025 report that about 79% of people drop at the awareness stage, roughly half of those who remain exit in the middle and 10–15% abandon right before purchase. This shows the importance of clear top‑of‑funnel messaging, persuasive middle‑of‑funnel content and a friction‑free checkout.
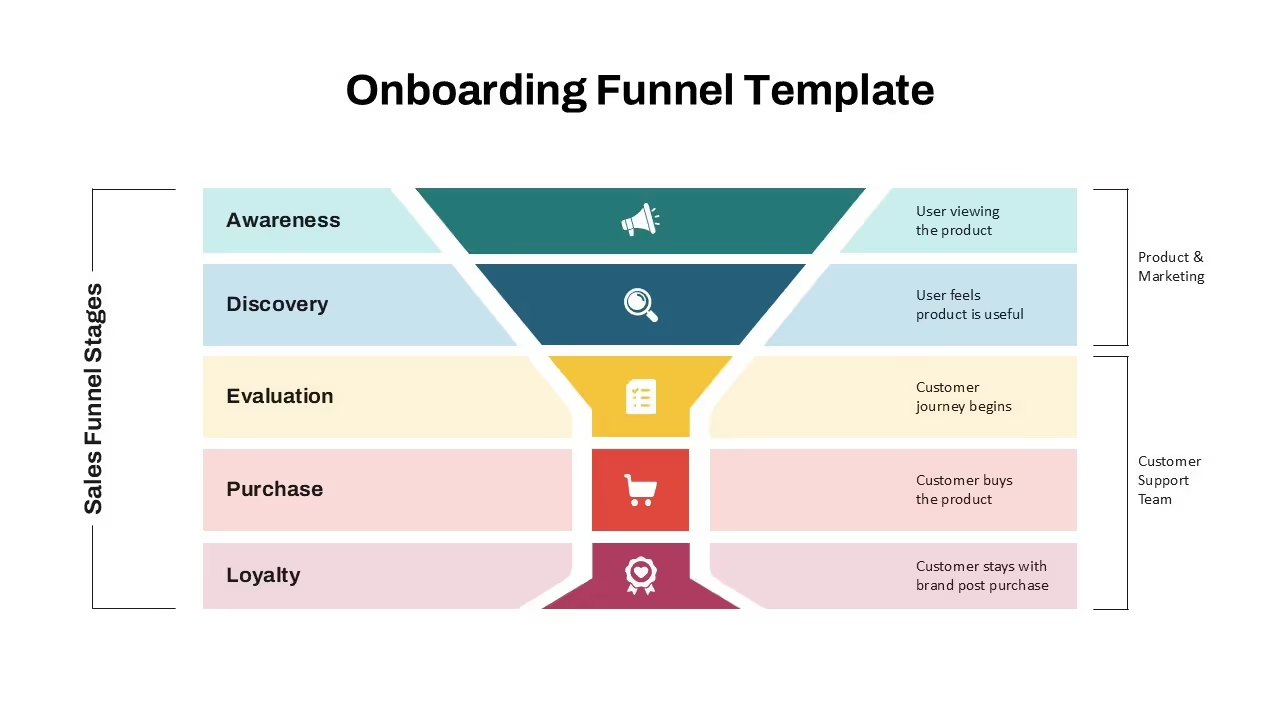
2) Product funnels: Product or onboarding funnels map how new users progress from sign‑up to activation to retention. Micro conversions such as opening a welcome email build toward macro conversions like using a core feature. In a typical SaaS example only 60 of 100 trial sign‑ups reach activation and 18 convert to paying customers. Investing in activation flows and timely nudges can raise those numbers.
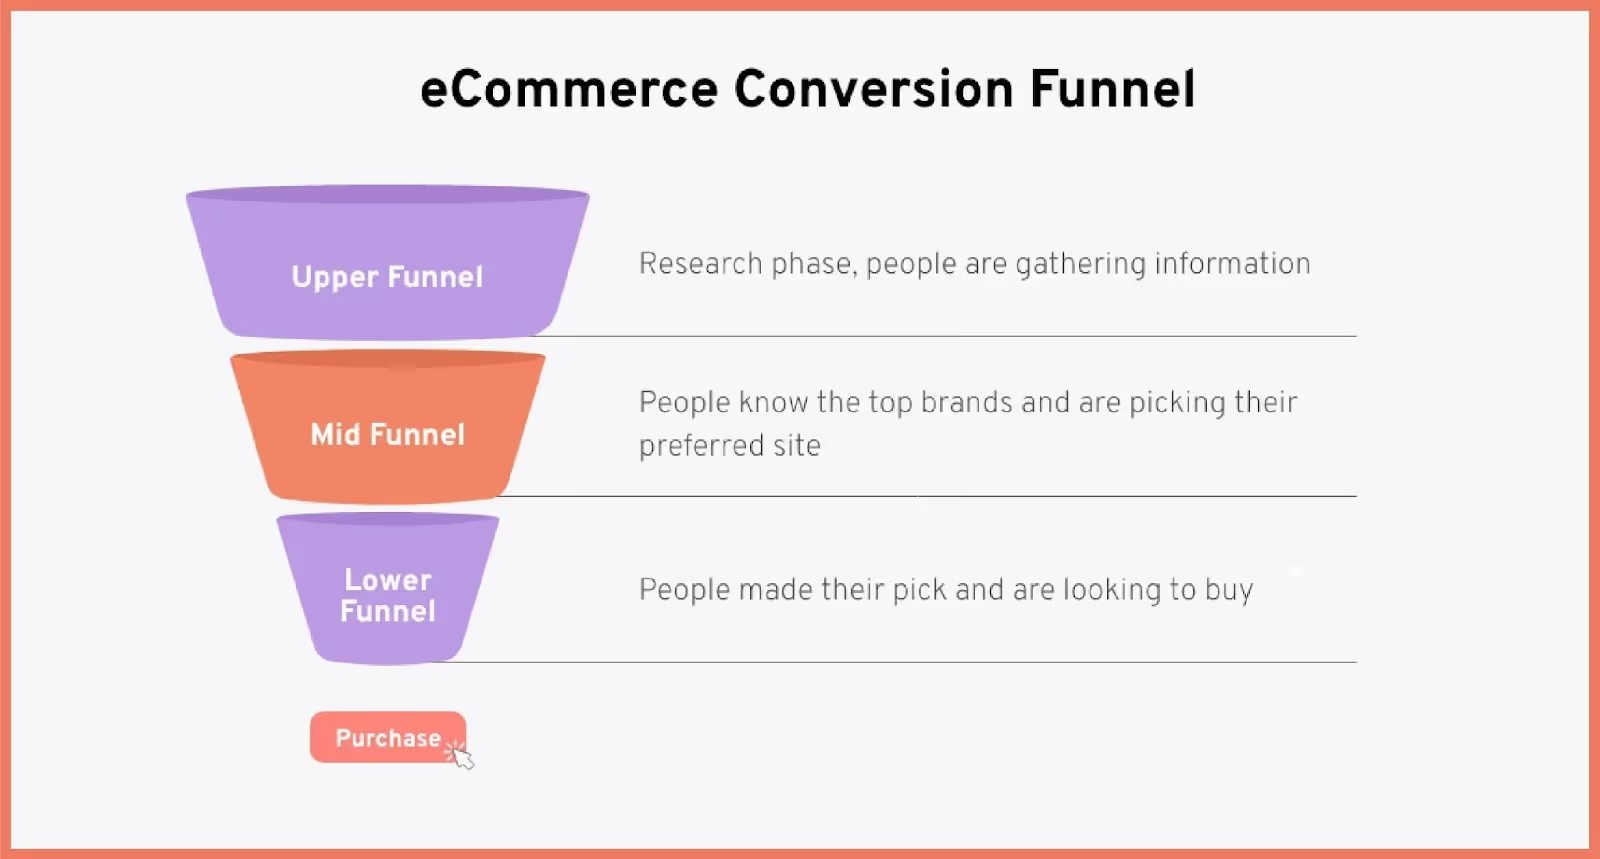
3) Ecommerce funnels: E‑commerce funnels trace the path from visit to purchase. Industry statistics show an average basket abandonment rate of about 70%, with 76.2% of mobile shoppers leaving and 68.1% on desktop. Removing checkout friction and retargeting basket abandoners can make a big difference.
4) Free-trial funnels: Free‑trial or subscription funnels in SaaS follow a similar pattern: sign‑up → setup → activation → upgrade. Steep drop‑offs between these steps mean that clear pricing, in‑product guidance and personalised outreach are essential. Together these examples illustrate how funnel analysis turns abstract user behaviour into metrics that point to action.

How to perform funnel analysis step by step

Step 1) Pick the finish line and time window
- Macro outcome: one clear goal such as “purchase,” “trial → paid,” or “demo booked.”
- Time window: how long someone has to finish (e.g., 7, 14, or 30 days). Short windows make issues surface faster; long windows fit slow cycles.
- Counting unit: people, sessions, or accounts. Pick one and keep it steady across reports.
Step 2) Draft the funnel map (with micro steps)
Write the exact steps someone should take on the way to the goal. Keep 4–7 steps.
- Example (SaaS): Landing → Sign up started → Sign up completed → Onboarding checklist started → Activation event (e.g., “project_created”) → Trial → Paid.
- Micro conversions that often predict success: search used, tutorial watched, help docs viewed, invite sent, file uploaded.
- For each step, define: When does it start? When is it counted? What rules must be true?
Step 3) Turn steps into trackable events
Create an event spec you can hand to devs.
- Naming style: verb_object (snake case) or Verb Object (title case). Pick one style.
- Examples: signup_started, signup_completed, search_used, tutorial_watched, checkout_completed.
- Required properties: user_id, anonymous_id, session_id, timestamp, platform, channel, device, plan, experiment_variant.
- Step-specific properties: for search → query_length, results_count; for tutorial → tutorial_id, completion_percent; for checkout → cart_value, payment_method.
- Identity rules: map anonymous → known user on login; avoid double counting.
Step 4) Instrument the tracking (client + server)
- Client events for UI actions (clicks, views, tutorial progress).
- Server events for source of truth (orders, billing, subscription status).
- Add environment prop (prod/staging), version prop for schema changes, and idempotency to avoid duplicates.
Step 5) QA with a short checklist
Before you trust numbers:
- Fire each event once, in the right order.
- Ensure timestamps are UTC and monotonic.
- Confirm required props exist and have sane values.
- Run through 5–10 real flows using test accounts.
- Compare server totals (e.g., orders) to analytics totals. They should be close.
Step 6) Build the funnel report in your tool
Whether it’s GA4, Mixpanel, Amplitude, PostHog, or SQL:
- Exact order vs any order: most product funnels use exact order.
- Conversion window per step: e.g., step 1→2 within 1 day, 2→3 within 3 days.
- Deduping: count the first occurrence of a step per person per window.
- Attribution: decide if you’ll tag each person with source/medium/campaign at entry.
Step 7) Read the core metrics
For each step:
- Step conversion rate: people who did step N+1 divided by people who did step N.
- Cumulative conversion: people who reached the finish line divided by people who started.
- Absolute counts: how many people you’re losing at each step.
- Time between steps: median and 90th percentile. Long gaps hint at friction.
Step 8) Segment to find where the problem lives
Slice by:
- Acquisition (source, campaign, ad group)
- Device and platform
- New vs returning
- Signup month (cohorts)
- Plan/price, country/region
- Feature usage (e.g., used search? watched tutorial?)
Look for large gaps between segments. That tells you where to focus.
Step 9) Pair numbers with user evidence
Numbers tell you where; user evidence tells you why.
- Session recordings & heatmaps: watch 10–20 sessions at the drop step.
- On-page surveys (1–2 questions): “What stopped you from continuing?”
- Usability tests: give people a task that crosses the drop step; watch and time them.
- Support tickets & chats: scan for patterns tied to that step.
Step 10) Form hypotheses and rank them
Write simple, testable statements:
- “If we shorten the signup form from 12 to 5 fields, step 2→3 will rise from 42% to 55%.”
Rank ideas using a quick Impact / Confidence / Effort score. Start with high-impact, low-effort changes.
Step 11) Ship one change at a time (or A/B test)
- A/B test basics: randomize, define primary metric (step rate), set guardrails (bounce rate, refunds), and pre-set duration/sample size.
- Avoid peeking early. End when you reach the planned sample or time.
- If traffic is low, use holdouts or sequential tests instead of many small splits.
Step 12) Measure impact the same way you measured baseline
- Rebuild the same funnel report with the same settings.
- Compare step rates, cumulative rate, and time between steps.
- Check segment stability: did one channel improve while another dipped?
- Sanity check for sample ratio mismatches or data glitches.
Step 13) Keep it current
Funnels drift as products change.
- Re-run your funnel weekly or monthly.
- Add alerts for sudden shifts in step rates or event volume.
- Version your event spec; deprecate old events cleanly.
Tools, platforms and measurement
Challenges, common pitfalls and how to avoid them

Even with good tools it’s easy to misread the data. Skipping micro‑steps hides friction, sloppy event definitions, distorted metrics and conversion windows that are too short under‑report long cycles. Looking at averages without segmentation masks differences between new and returning users. Long funnels can become noisy, so focus on the critical stages. Pay attention not only to where people leave but also to where they succeed — high‑performing segments can inspire ideas for everyone.
Using funnel analysis to drive action and revenue
Funnels are only as useful as the actions they inspire. Once you find the largest leak, focus on it: simplify your flows, remove unnecessary fields, clarify messaging and reduce friction — in particular on mobile where basket abandonment reaches 76.2%. Retarget lost users with thoughtful outreach, test each change and measure its impact. Even small gains can have big effects downstream because improvements at one stage multiply across the funnel.
Putting it all together: sample workflow for early‑stage startups
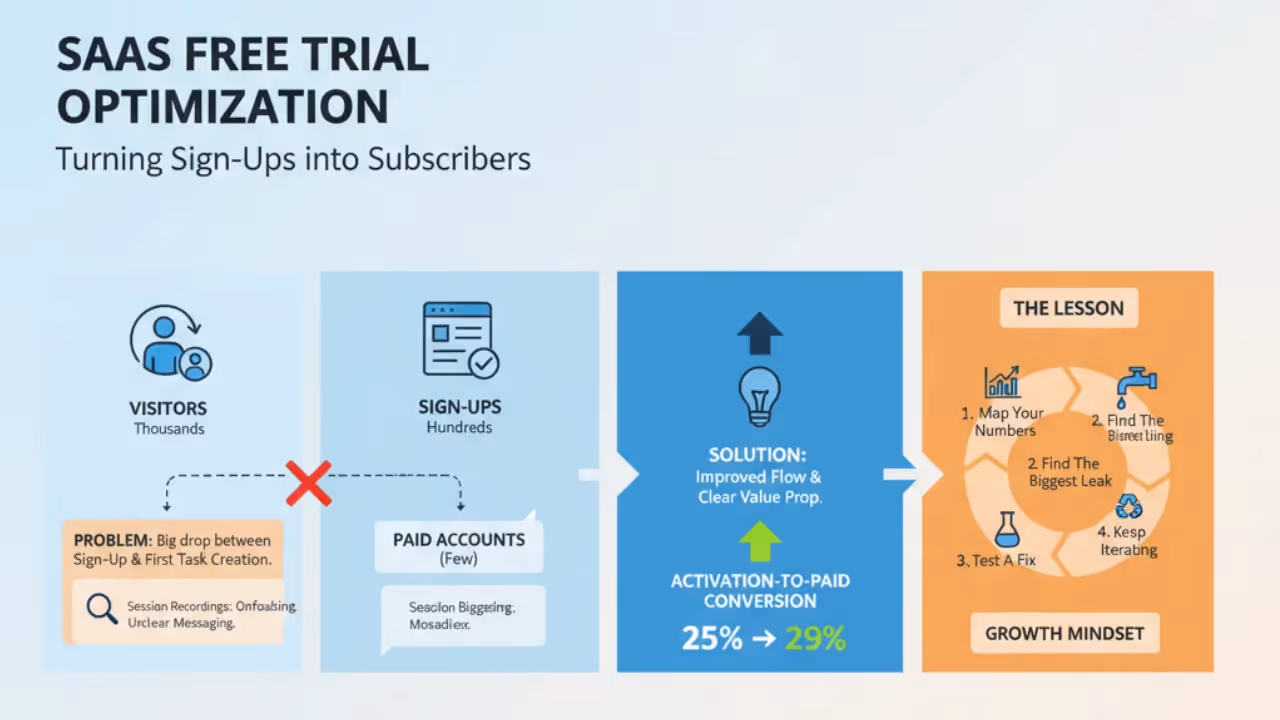
Imagine a small SaaS firm with a free trial. They notice that thousands of visitors and hundreds of sign‑ups result in only a few paid accounts. By instrumenting their funnel they see a big drop between signing up and creating the first task. Session recordings reveal confusing onboarding and unclear messaging. After improving the flow and clarifying the value proposition, their activation‑to‑paid conversion climbs from 25% to 29%. The lesson: map your numbers, find the biggest leak, test a fix and keep iterating.
Conclusion
A well‑constructed funnel analysis helps you see the story behind your numbers. By visualising how people move from awareness to value, you can stop guessing and start fixing what matters. Statistics from recent research are sobering — 79% of people drop off at the top of the funnel, basket abandonment hovers around 70% and only 18% of trial users become paying customers. But those numbers are liberating because even small improvements compound. Improving a single step can ripple through the entire flow.
The process isn’t complex. Define your goal, map the flow, instrument events, analyse the data, test hypotheses and iterate. See funnel analysis as an ongoing conversation with your users. Numbers tell you where to look; qualitative research tells you why. At this point the question shifts from what is funnel analysis to how you’ll apply it. With patience and curiosity, each insight builds on the last. Soon you’ll be less focused on traffic spikes and more invested in guiding people smoothly from first touch to lasting value. That’s how sustainable products are built.
FAQs
1) What is funnel analysis?
A funnel analysis is a method for understanding the steps users take to reach a desired outcome and seeing how many make it through each step. By mapping both micro and macro conversions, you can identify where users drop off and why.
2) What is an example of a funnel method?
An ecommerce funnel might track users from a homepage visit to a product view, to adding an item to the basket, to checkout and then to purchase. A SaaS funnel might go from signup to activation and then to paid subscription. In Userpilot’s example, 100 trial users sign up, 60 reach activation and 18 convert to paying customers.
3) What does a funnel analysis help us understand?
It helps you see where people abandon the process, which segments perform better or worse, how long users take between steps, and which micro conversions lead to macro outcomes. For instance, drop‑off data from 2025 shows that around 79% of users leave during the awareness stage and 40% of customers churn within a year. Knowing this helps you focus your efforts.
4) What is the funnel concept?
The funnel concept visualises the customer path as a narrowing route. Many people enter at the top, fewer progress through each stage and only a small portion reach the end. It’s a metaphor because the shape resembles a physical funnel, with drop‑offs at each stage illustrating how the audience narrows.

check out these related blogs


.avif)