Picture this: a new customer signs up for your product. They bounce between a signup form, an automated email, and a friendly support rep. Behind the scenes, developers provision their account, ops folks ship a welcome kit and billing triggers a recurring invoice. Each group does its part, yet missteps slip through. When service delivery feels like a relay race with dropped batons, it’s time to ask what is a service blueprint and how it can help.
A service blueprint is a visual map of everything that has to happen for a customer to have a good experience. It doesn’t stop at what users see; it also tracks the hidden work that makes each touchpoint possible. Founders and product leaders crave clarity on how people, technology, and processes fit together. Design leads want a shared picture that stops teams from working at cross purposes. This article unpacks why blueprints matter, what they include, how to build one, when to use one, and gives examples of how we’ve used them at Parallel.
What Is a Service Blueprint?
A service blueprint is a visual diagram that maps out every touchpoint in a user journey alongside the internal processes required to support it. While a journey map focuses on the user, a blueprint provides a clear look at:
- Frontstage: Everything the customer sees and interacts with.
- Backstage: Internal employee actions and automated systems that must fire to deliver the service.
- Support Processes: The foundational infrastructure (logic, data, and protocols) that ensures seamless delivery.
Why it matters in 2026: In an AI-driven economy, blueprints are essential for identifying technical friction points and automating "backstage" tasks without losing human-centered "frontstage" value.
Why service design needs more than a path map
Service design is more than making interfaces look nice. It’s the discipline of organising people, tools and processes to improve both employee and customer experience. A customer path map shows what users do step by step. A service blueprint goes deeper: it visualises the connections between the people delivering the service, the props or evidence that prove an interaction happened, and the processes that support them. Nielsen Norman Group calls it the primary mapping tool for service design because it links a specific customer goal to all the systems and teams needed to deliver it.
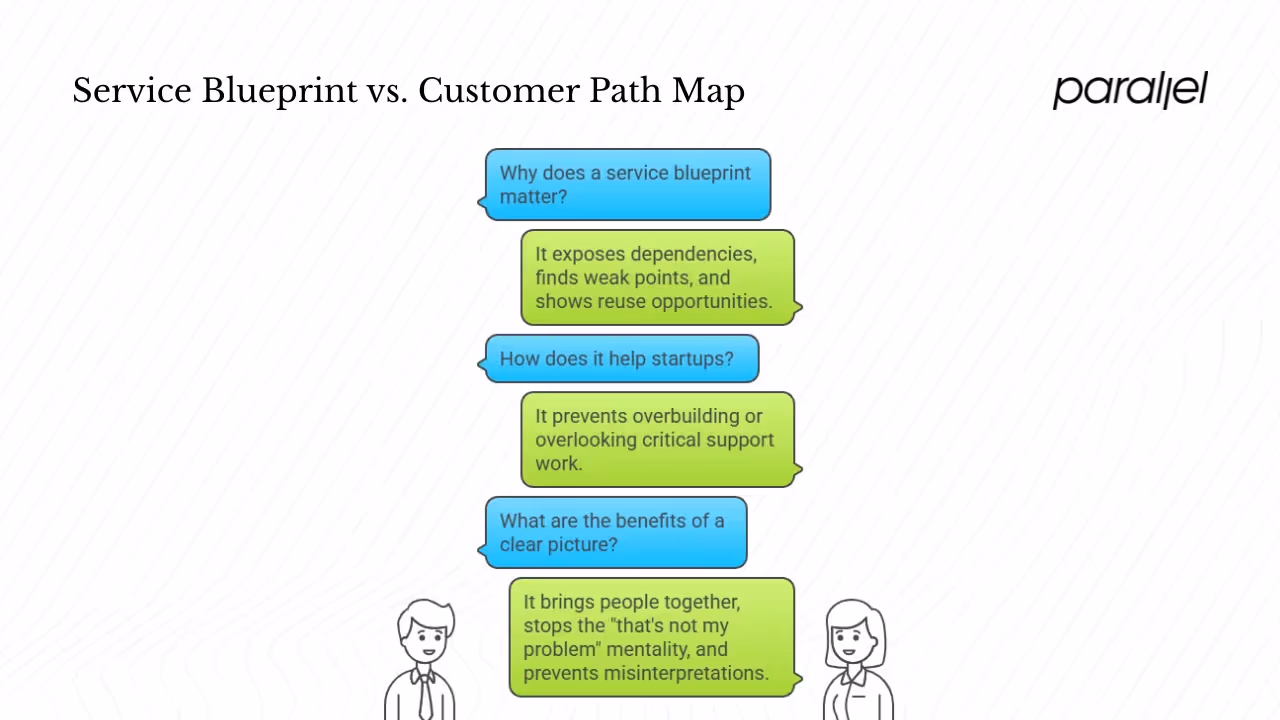
Why does that matter? Because it’s hard to fix experience issues without seeing the underlying causes. A blueprint exposes dependencies across departments. It helps find weak points such as redundant steps, long waits or siloed hand‑offs. It also shows opportunities to reuse information collected earlier, saving customers and employees from repeating themselves. For startups, this kind of clarity prevents you from overbuilding or overlooking critical support work. A clear picture brings people together around a shared understanding and stops the “that’s not my problem” mentality. As Engine CXD notes, blueprints provide a single, easily understood picture that prevents different teams from interpreting the target design differently. In our work with early‑stage SaaS teams, we’ve seen them bring product, marketing, ops and support into one conversation rather than four separate ones.
The anatomy of a service blueprint
Every blueprint has a few consistent lanes. These lanes sit on different levels, separated by lines that help you understand what the customer sees versus what happens behind the curtain. Below is a plain‑language breakdown of the core pieces.
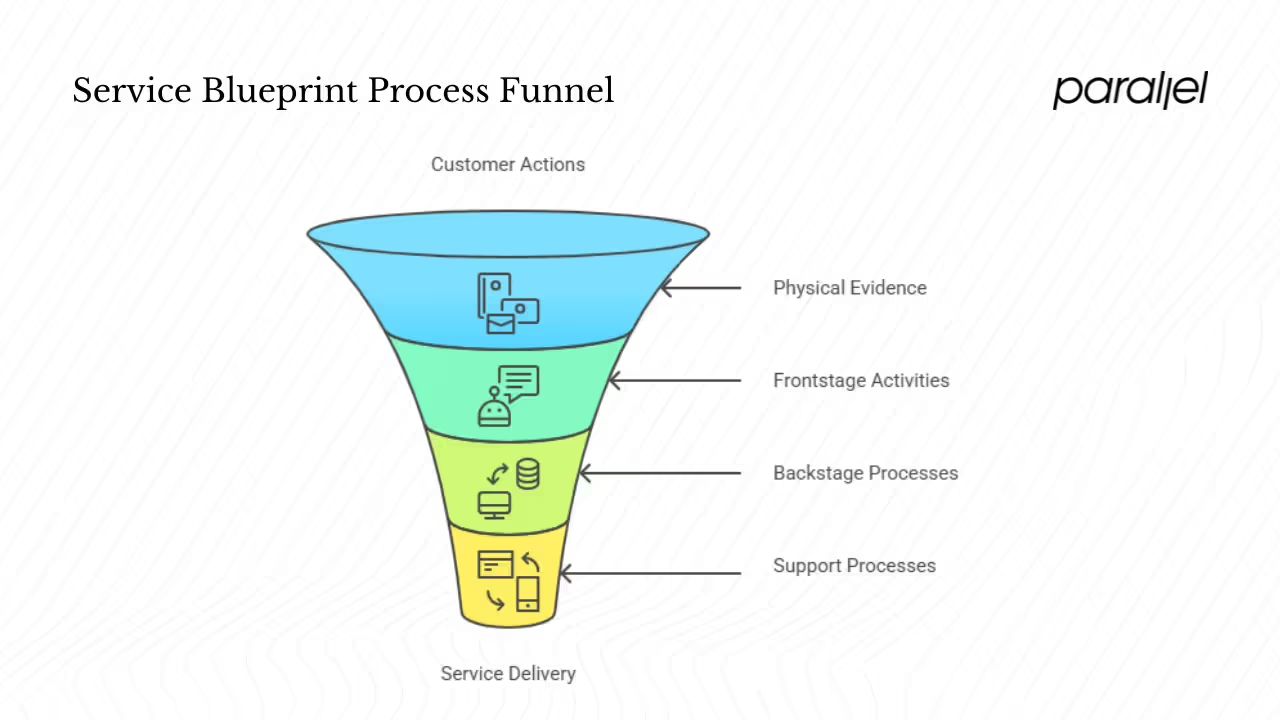
1) Customer actions
Start with what the person does. These are the steps, choices and interactions a user performs to achieve a goal. They might include visiting your site, chatting with a support agent or waiting for an activation email. Research and existing path maps feed this lane. By starting here, you make sure the blueprint stays grounded in real behaviour rather than assumptions.
2) Physical evidence and touchpoints
Anything that proves an interaction happened belongs here: receipts, confirmation emails, a page on your site, an onboarding email, signage in a store, even the packaging of a shipped item. The Interaction Design Foundation defines physical evidence as what customers and employees come in contact with at each step. Recording these artefacts helps you see where experiences are fragmented. For example, a user might switch from a welcome screen to an automated chatbot to a manual support email. Documenting every touchpoint prevents drop‑offs.
3) Frontstage activities
This lane covers actions that happen in full view of the customer. These include interactions with staff or technology such as chat bots, self‑service portals, or a waiter taking an order. Nielsen Norman Group reminds us that each visible interaction is a “moment of truth” where customers judge quality. In technology‑driven services, frontstage might include signing up, clicking through a tutorial or receiving an automated text. It’s important to map these because they set expectations for what happens next.
4) Backstage processes
Backstage actions happen out of sight. They might involve a cook in a kitchen, a developer updating a database or a quality‑assurance specialist double‑checking an order. These unseen tasks support everything above them. Documenting them reveals where internal systems need work. For instance, your email automation may rely on a CRM update that takes five minutes longer than expected, leading to mismatched timing between what a user sees and when data is processed.
5) Support processes and infrastructure
Support processes represent the foundation of the service. They include payment systems, third‑party logistics, infrastructure and other activities that enable both the frontstage and backstage. Without these, nothing else works. Vaimo calls them supporting platforms: the software, equipment, suppliers and delivery services that underpin the service. Explicitly mapping this layer is vital for startups because it forces you to acknowledge dependencies on vendors, tools or manual work.
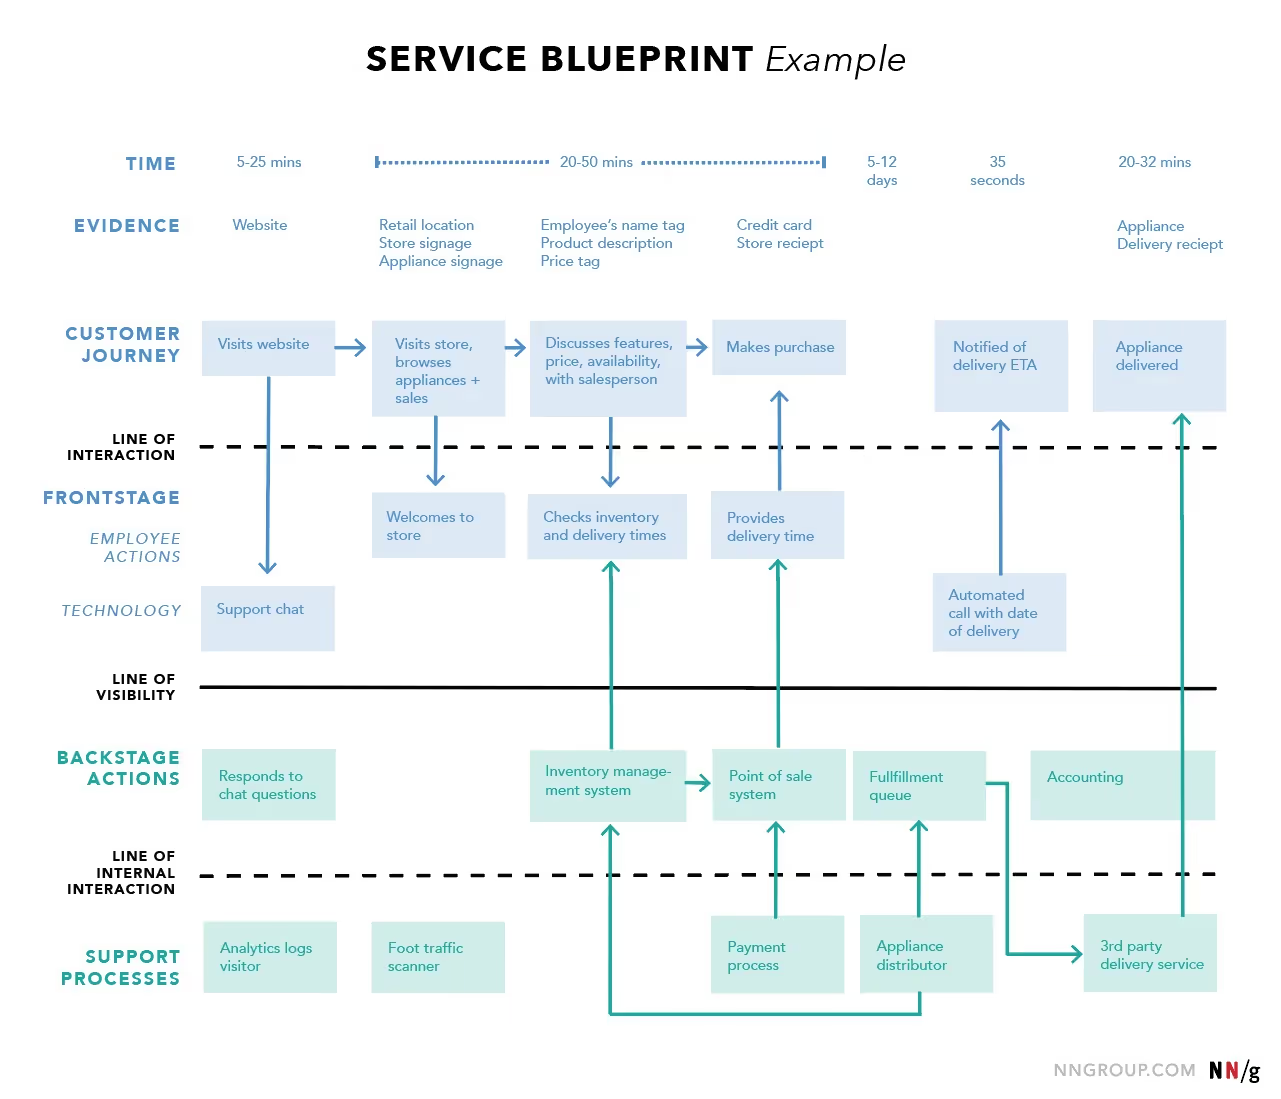
6) Lines in the blueprint
Blueprints use three horizontal lines to separate the lanes and make interactions explicit. The line of interaction marks the points where users and the organisation meet. The line of visibility separates what customers can see from what they can’t. The line of internal interaction divides customer‑facing staff from those who don’t interact directly with users. When you draw these boundaries, hidden complexity becomes visible. Markswebb explains that the line of visibility shows which parts of the service process the customer can see and which are internal operations, while the line of interaction highlights all points of contact from initial enquiry to follow‑up.
Extras to make your blueprint richer
Blueprints aren’t one‑size‑fits‑all. Once the core lanes are in place, you can add layers to suit your goals. Nielsen Norman Group suggests several optional elements: arrows to show dependencies between actions; estimated time for each step when duration matters; policies or regulations that constrain the process; and emotional cues to capture how staff and customers feel.
Interaction Design Foundation goes further and proposes adding metrics such as cost or success rates to support arguments for change. Vaimo recommends adding time, emotions and metrics to indicate how long each step takes, how people feel and how well the service performs. Choose the extras that help tell the story you need to tell. For example, if your product is regulated, include notes about compliance. If you’re chasing conversion improvements, add success metrics.
Building a blueprint: a founder’s step‑by‑step guide
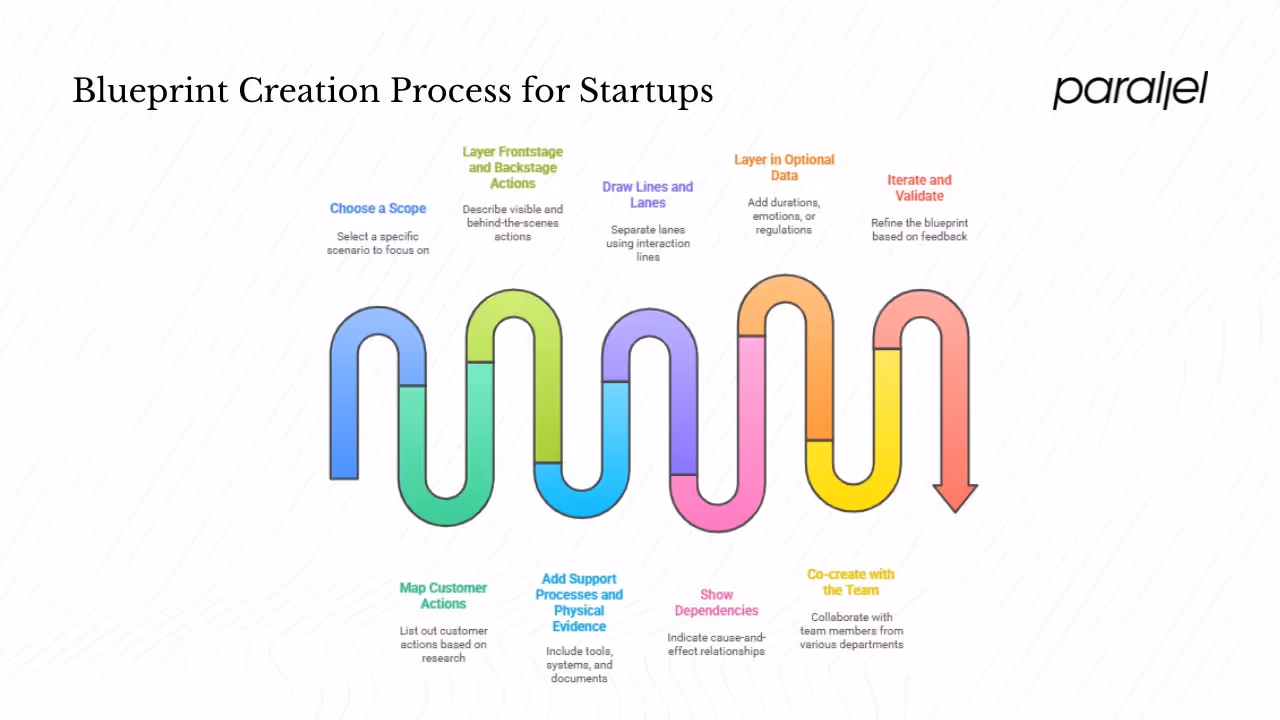
Creating a blueprint is both structured and collaborative. Here’s a straightforward process we use at Parallel when helping startups gain clarity on their service delivery.
- Choose a scope: Start small. Pick a specific scenario such as sign‑up, onboarding or a support ticket. Defining the scope keeps the work manageable and gives you a clear goal.
- Map customer actions first: Use research, support tickets and observational studies to list out what people do. Stay factual and avoid guessing.
- Layer in frontstage and backstage actions: For each customer action, describe what is visible and what happens behind the curtain. Include human and technology interactions as well as internal tasks.
- Add support processes and physical evidence: List the tools, systems, vendors, documents or artefacts involved at each step. This makes dependencies explicit.
- Draw lines and lanes: Use the lines of interaction, visibility and internal interaction to separate the lanes. This helps stakeholders see who does what and when.
- Show dependencies: Use arrows to indicate cause‑and‑effect relationships or two‑way exchanges. Single arrows show linear hand‑offs; double arrows show that both sides need to coordinate..
- Layer in optional data: If time matters, add durations. If feelings matter, map emotions. If regulations apply, note them.
- Co‑create with the team: Bring people from product, engineering, operations and support into the room. Blueprints aren’t a solo activity. They act as a shared reference that gets everyone on the same page.
- Iterate and validate: Start with a rough sketch, share it, then refine. Use it as a living document. At each iteration, ask: is this still reflecting reality? Are we missing steps? Are we solving the right problem? As Dovetail recommends, review and validate the blueprint with employees and customers to ensure it accurately reflects their experiences.
By following these steps, a scrappy team can build a useful blueprint in a day or two. We’ve done quick workshops using Miro or Lucidchart, but sticky notes on a whiteboard work just as well. The goal is clarity, not artistry.
When to use a service blueprint
You don’t need a blueprint for everything. It’s most useful when multiple teams touch an experience or when hand‑offs lead to gaps. Dovetail points to service design and improvement, customer experience management, problem solving and cross‑functional collaboration as common scenarios for blueprinting. Planning a new product or changing a business model is another good time; a blueprint helps identify dependencies and resources before you commit to a new direction. Engine’s practitioners add that blueprints are helpful for planning new services, improving existing ones and creating performance indicators.

I’ve found blueprints particularly helpful when we’ve shifted a service model. For example, we once helped a software firm move from high‑touch enterprise onboarding to a lower‑touch self‑serve model. Mapping the original process showed how much manual work was involved and where automation could safely take over. After drawing the blueprint, the team reorganised tasks, built a self‑serve provisioning tool and cut onboarding time by 60%.
Startup‑friendly examples
Let’s ground this in situations you might face. Suppose you’re mapping your signup and onboarding flow. The user lands on your home page, enters their email, confirms via a verification link, receives a welcome email, and explores a tutorial. Behind the curtain, your system creates a record, triggers a welcome campaign, sets up default settings, and notifies customer success to check in. The blueprint would capture each visible interaction, the behind‑the‑scenes work, the physical evidence like emails or chat transcripts, and the support infrastructure such as authentication services or payment gateways. Lines would separate what the user sees from what your team does.
Another example comes from hospitality. Vaimo explains that a restaurant might have separate blueprints for dine‑in versus take‑away orders. Each blueprint maps the steps for customers and staff, from greeting and ordering to cooking and payment. In finance, a bank may map how a user opens an account in branch versus via the web. The paths look different, and the backstage work may be handled by different teams.
Service blueprint examples from major brands show how adaptable the method is. The CX Lead reports that companies like Airbnb, Spotify and Starbucks share their blueprints to demonstrate how they improve experiences. The article notes that service blueprints used to be found mainly in large industries like healthcare, tourism and banking, but they have gained traction in smaller settings over the last few years. This shift underscores that even small systems have layers of complexity that can benefit from visualisation.
Conclusion
When you hear someone ask what is a service blueprint, think of it as a map for both the customer and the company. It links the path a person takes with the people, tools and processes that support that path. In our practice, we’ve seen blueprints uncover process gaps, reduce waste, and bring teams together around shared goals. They go beyond surface‑level mapping by revealing what’s hidden and why it matters.
If you’re a founder or product leader, start by picking one flow that causes confusion—maybe sign‑up, checkout or support escalation. Use the steps above to sketch your first blueprint. Share it with your team, refine it and make it part of your decision‑making. A good blueprint is a conversation starter. It keeps people honest about how work happens and invites everyone to collaborate.
FAQs
1) What is a blueprint example?
In this context, a blueprint is a visual map showing customer actions, frontstage and backstage work, support processes and physical evidence. An example might be a restaurant mapping the steps for dine‑in guests versus take‑away orders. Each map includes actions, staff interactions, kitchen tasks and infrastructure, separated by lines to show visibility.
2) What is a service blueprint Quizlet?
Quizlet is a study tool. A service blueprint deck on Quizlet would be a set of flash cards explaining the definition, components and benefits of service blueprints. It’s not an official method, just a learning aid.
3) What is the main purpose of a blueprint?
The purpose is to show how a service is delivered end to end. It highlights the connections between user actions, internal operations and evidence. By making those links clear, it helps teams see gaps, improve processes and provide better experiences.
4) What does service blueprinting tell us about what a business is?
A blueprint reveals how work actually gets done. It shows who does what, which systems support them, where visibility ends and where dependencies exist. In doing so, it gives insight into the priorities, constraints and organisational structures that shape the service.

check out these related blogs


.avif)


.webp)