In the chaos of a young company it often feels like everything is urgent. New features, bugs, hires and user feedback all compete for attention. In those moments a regular status update can be the difference between progress and confusion. A status report is simply a structured update that makes sense of the noise. It captures where you stand now, how that compares to the plan and what comes next. As founders and product leaders at Parallel we learned that a clear status update is not just a formality; it is a lifeline that keeps our teams, investors and users aligned. In this article I will explain what a status report is, why it matters, how it differs from a progress report, how to write one and how to adapt it to design, product and tech contexts.
What is a status report?
The basic definition is straightforward: it is a document that gives a snapshot of the current state of a project at a specific point in time. Nulab’s project‑management guide explains that a status report “gives a broad overview of where a project stands at a specific point in time, which managers then compare with the original plan” and typically includes milestones, team achievements, risks and next steps. Atlassian adds that a status report provides “a comprehensive overview of a project’s current state, including data on progress and other aspects”. Taken together, these descriptions show that a good status report is less about telling a story and more about presenting clear, relevant facts.
Key elements of a status report include:
- Project update — a concise summary of the project goals and current state.
- Progress tracking — how the work completed compares with the plan, often expressed as a percentage or milestone checklist.
- Ongoing tasks — what the team is currently working on and any dependencies.
- Performance summary — metrics like budget usage, burn rate or velocity that indicate health.
- Issue reporting — known risks, blockers and their impact.
- Resource allocation — how people, time and budget are assigned and any gaps.
- Stakeholder communication — clear messages for everyone involved, not just the immediate team.
For early‑stage startups these reports offer clarity in a fast‑moving environment. When resources are limited and cross‑functional teams overlap, a concise snapshot prevents misunderstandings and keeps everyone rowing in the same direction. It is also worth pointing out what a status report is not. It is not a full project plan; it does not replace a roadmap or backlog. It should also not be an overly technical dump meant only for engineers or designers. Its strength lies in accessible communication.
Why status reports are important
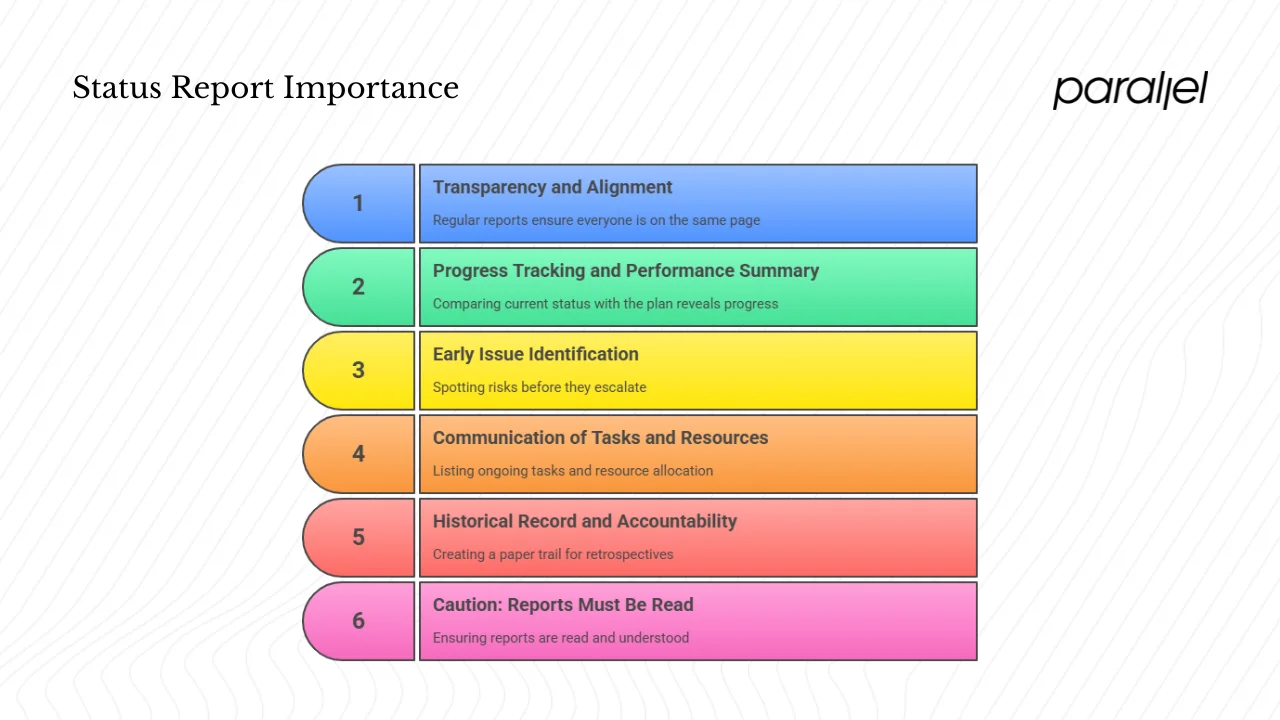
1) Transparency and alignment
A well‑crafted status report brings visibility. Nulab notes that regular reports “keep everyone on track” and that their role in team and stakeholder communication is central. By sharing a common understanding of the project’s state, founders, designers, developers and investors can make decisions based on the same facts. This transparency reduces gossip, second‑guessing and wasted meetings.
2) Progress tracking and performance summary
Comparing the current status with the original plan reveals whether things are on track or slipping. Metrics such as completion percentage, velocity and budget burn help leaders decide when to course‑correct. Atlassian points out that a status report lets you compare the current state with planned milestones and budgets. Over time these snapshots become a valuable record of decisions and outcomes.
3) Early issue identification
Regular status updates make it easier to spot risks before they explode. Nulab highlights that good status reporting “helps all involved spot and address issues early”. UpperEdge advises focusing on exceptions rather than recapping last week’s work; teams should clearly highlight deviations from the plan and link them to risks, actions, issues and decisions. By surfacing problems early, teams can mobilize resources and prevent small blockers from turning into crises.
4) Communication of tasks and resources
A status report lists ongoing tasks, upcoming milestones and resource allocation. This information helps prioritize work and ensures that no one is surprised by shifting deadlines. For product and design teams this reduces dependency bottlenecks and shows the value being delivered.
5) Historical record and accountability
Each report creates a paper trail that can be reviewed during retrospectives or audits. Nulab explains that regular reports “create a shared history of the project’s progress”. This historical record enhances accountability and allows teams to learn from past decisions. It also builds trust with investors and stakeholders who appreciate being kept in the loop.
6) Caution: reports must be read
Project Management Academy reminds us that the time spent creating a report only pays off if it is read. The article advises asking recipients how much of the report they actually read and tailoring content to focus on useful information. If your report is buried in a shared drive or overloaded with jargon, its value diminishes. Making reports easy to find and digest increases their impact.
Status report vs progress report and other terms
It is easy to confuse a status report with a progress report. Both provide updates, but they emphasize different aspects. Before diving into the differences, it is helpful to revisit the issue of a status report so that you know what you are comparing.
Progress report
A progress report focuses on what has been completed over a period of time. It traces the trajectory of work and highlights achievements and upcoming tasks. Nulab’s article explains that a progress report “looks at the project’s change over time,” detailing work completed, advancements and future plans. Progress reports often include charts showing trends or variations over several weeks or months.
Status report
A status report, as defined earlier, is a snapshot of the project’s current state. Atlassian writes that it provides a “comprehensive overview of a project’s current state” while a progress report “focuses on the completed tasks and project milestones”. In other words, status reports look at what is true right now relative to the plan, whereas progress reports look at how far you have come and where you are heading.
Comparison table
| Aspect | Status report | Progress report |
|---|---|---|
| Focus | Snapshot of current health; plan vs. actual; immediate issues | Trajectory over time; tasks completed; advancement trends |
| Audience | Broader, including stakeholders and leadership | Often internal and team-oriented |
| Content | Health indicators, risks, tasks, resource allocation, next steps | Completed tasks, milestones reached, metrics showing progress |
| Purpose | Communicate current state and what needs attention | Demonstrate movement towards goals and highlight achievements |
Related terms include project update, performance summary and milestone update. These overlap with status reports but may vary in scope. A project update is a broad term for any communication about project state. A performance summary usually focuses on metrics like budget or velocity. A milestone update highlights whether a specific milestone was reached. Understanding these nuances helps you choose the right format and avoid confusion.
Types and cadence of status reports
Status reports vary by frequency and audience. Common cadences include:
- Daily status reports — used for rapid iterations or crisis periods. Everhour notes that a daily status report provides a brief update on completed tasks, ongoing work and immediate issues. These are best for short sprints or hackathons.
- Weekly status reports — the most common cadence for startups. They offer more detail, including achievements, challenges and upcoming tasks. A weekly rhythm balances effort with the need for timely feedback.
- Monthly status reports — useful for projects with longer timelines or for leadership updates. They provide an in‑depth review of progress and budgets.
- Quarterly status reports — high‑level summaries for investors or board members. They focus on major achievements and strategic alignment.
You can also classify reports by audience: team‑level updates, sponsor reports or portfolio reports. Team‑level reports are granular; sponsor reports are concise and highlight business outcomes; portfolio reports summarise several projects for executives. For early‑stage startups, I have found that weekly reports for the core team and monthly or quarterly summaries for investors strike a good balance. Too frequent reporting wastes time and can be burdensome. Too infrequent and you risk surprises.
Regardless of cadence, each report should cover milestones, team activities, deadline status and resource allocation at a depth appropriate to the audience.
When choosing a cadence, remember what a status report meant to accomplish. If the goal is frequent alignment, daily or weekly reports make sense. If the objective is strategic oversight, monthly or quarterly updates are enough.
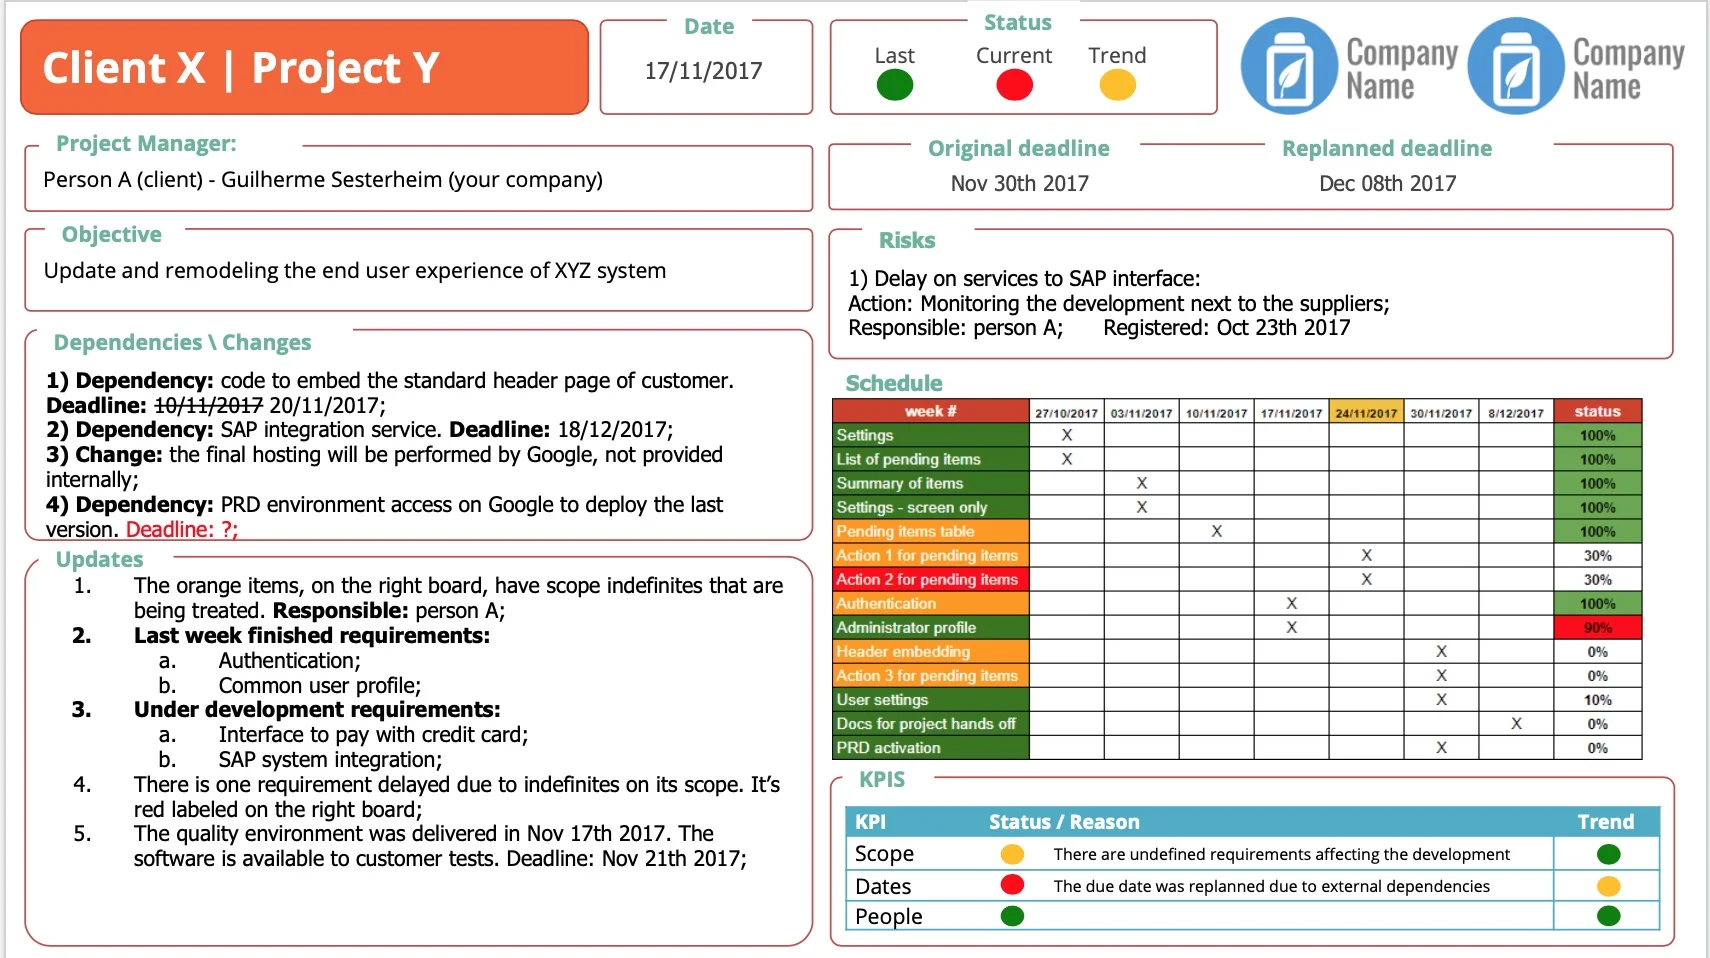
Core components of a good status report
Drawing from Nulab, PMI and other sources, I use the following structure for effective status reports. Understanding what is a status report will help you decide which components matter most. Each component has a purpose and common pitfalls to avoid.
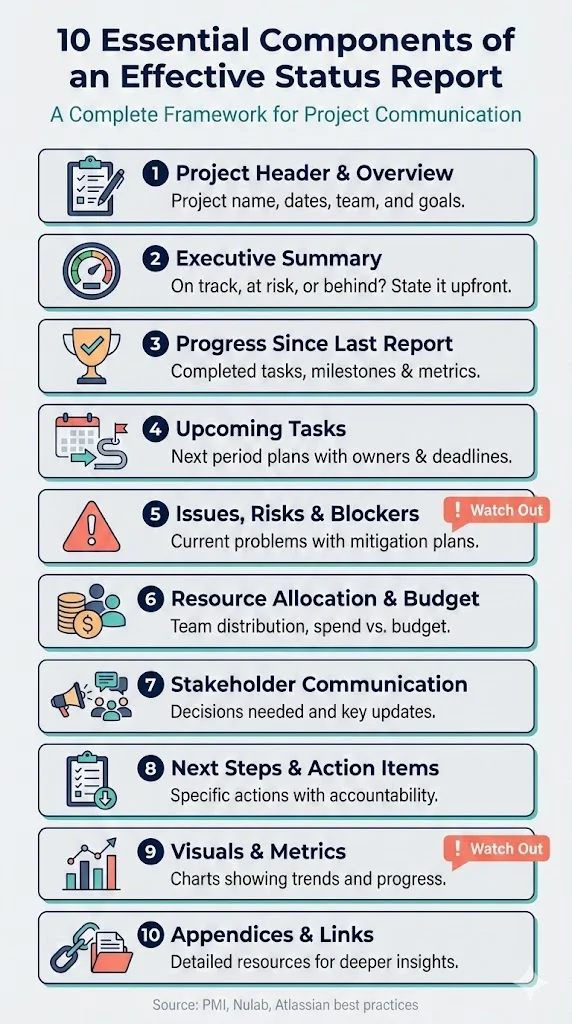
1) Project header and overview
Start with the basics: project name, reporting period, date and team. Give a quick summary of the project goals and key metrics so readers know the context. Nulab lists the project header and overview as one of the essential elements.
Watch out for: forgetting to specify the reporting period or version number, which can create confusion about what period the report covers.
2) Executive summary / project health
In one or two sentences, state whether the project is on track, at risk or behind schedule. Mention major accomplishments and significant issues. PlanAcademy stresses getting to the point early: a report’s entire job is to update the reader, so “get to the point early” and consider an executive summary at the top. Resist the temptation to bury this overview under details.
Watch out for: vague health indicators or subjective color coding. UpperEdge warns that red, yellow and green indicators can be arbitrary if not backed by facts. Always include a brief explanation.
3) Progress since last report
List completed tasks, achievements and milestones. Provide metrics such as percentage complete or velocity. This section shows movement and helps stakeholders appreciate progress. Nulab suggests highlighting completed tasks and milestones in a “progress since last report” section.
Watch out for: rehashing every detail. Summarize major achievements and link to a backlog or appendix for more detail.
4) Upcoming tasks and milestones
Describe what is planned for the next period, who is responsible and any dependencies. Include deadline status and whether upcoming deadlines are at risk. This information helps with prioritization and resource planning.
Watch out for: listing tasks without owners or dates. Assign accountability to specific people or teams.
5) Issues, risks and blockers
Identify current issues and potential risks. For each risk, explain the impact and mitigation plan. For startups, this might include resource constraints, dependencies on external teams, technical debt or pending design decisions. UpperEdge advises focusing on exceptions and linking each to a Risks, Actions, Issues and Decisions (RAID) item.
Watch out for: hiding problems. Failing to surface issues early undermines trust and can lead to surprises.
6) Resource allocation and budget
Indicate how people and budgets are distributed and whether there are gaps. This section may be shorter for early‑stage startups but is still important when you are balancing multiple initiatives. Provide burn rate and compare spend vs. budget if relevant.
Watch out for: ignoring time or cost overruns. Highlight variances and propose adjustments.
7) Stakeholder communication and decisions needed
Clarify who needs to know what and what decisions are required. This ensures the report is actionable. If you need a decision from leadership on scope or budget, call it out here.
Watch out for: assuming stakeholders will read between the lines. Make requests explicit.
8) Next steps and action items
List specific actions, responsibilities and deadlines for the next period. This creates accountability and ties into progress tracking for the next report.
9) Visuals, data and metrics
Use charts and graphs to illustrate trends such as budget burn, burndown or resource allocation. Atlassian and Nulab both recommend using visuals to make data easier to understand. For design and product teams, you might include user research metrics or feature adoption charts.
Watch out for: cluttered visuals. Use simple charts that support the narrative.
10) Appendices or links to detail
Provide links to dashboards or documents for those who need deeper insights. Project Management Academy suggests that instead of stuffing every detail into the report, you can link to resources or appendices and avoid jargon. This keeps the main report readable while still offering depth.
How to write a status report in a startup, product and design context
Over the years at Parallel we refined a process for creating reports that resonate with founders, designers and engineers alike. Before you start writing, ask yourself what is a status report and who needs to read it. That simple question clarifies your objective and shapes the content.
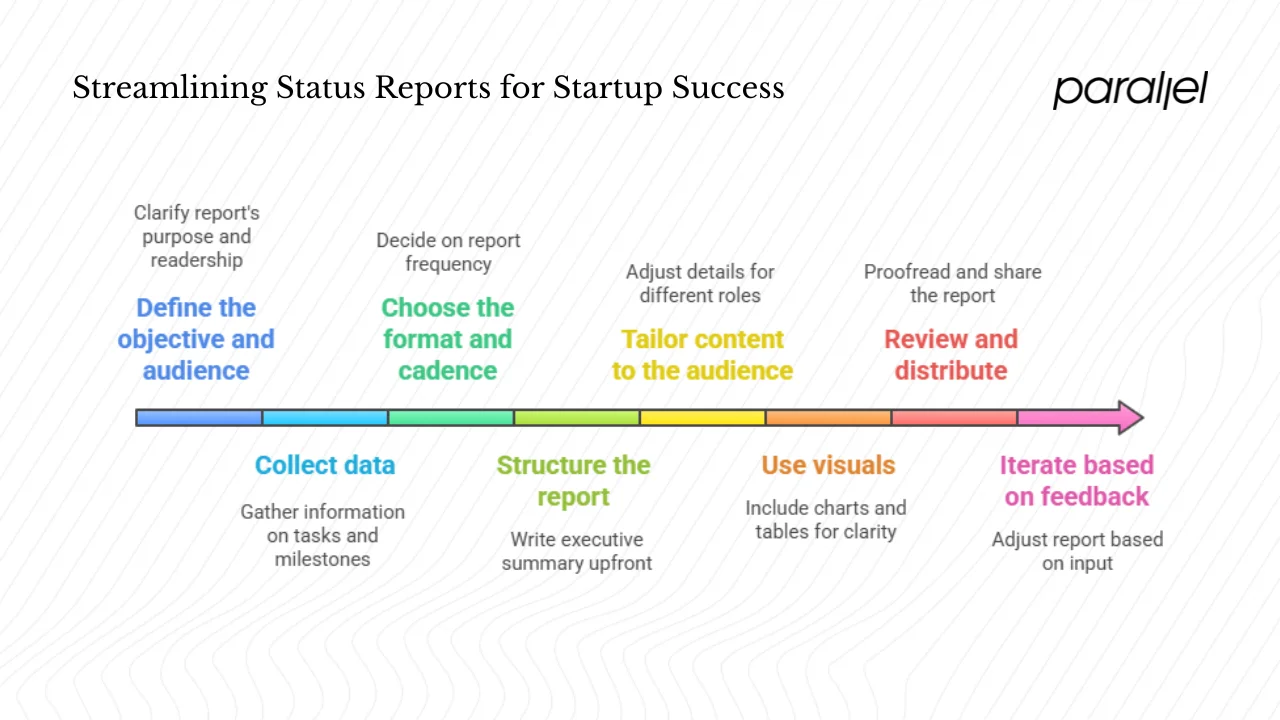
- Define the objective and audience. Start by clarifying why you are writing the report and who will read it. Nulab recommends defining the purpose first. Is it to align the core team, inform investors or unblock dependencies? Knowing the audience influences the level of detail and the tone.
- Collect data. Gather information on completed tasks, ongoing work, milestones, resource usage and risks. This might involve pulling metrics from Jira or Notion, talking to team members or reviewing the roadmap.
- Choose the format and cadence. Decide on weekly, monthly or another frequency based on team size and project volatility. For early‑stage SaaS teams, we found that weekly internal reports and monthly investor updates worked well.
- Structure the report. Use the core components outlined above. Write the executive summary first. PlanAcademy’s tip to “get to the point early” helps ensure busy readers see the most important information upfront.
- Tailor content to the audience. PlanAcademy also advises knowing your audience; coders may appreciate granular details while executives prefer high‑level summaries. For design leaders, include feature build status, user research findings and design backlog. For product managers, link the update to roadmap milestones, user metrics or experiment outcomes. For engineers, mention release status, QA progress, technical debt and dependencies.
- Use visuals. Where possible, include charts or tables to illustrate progress, budgets or sprint burndown. Visuals make it easier for readers to grasp the state of the project quickly. Everhour suggests using charts and status indicators for visual clarity.
- Review and distribute. Proofread for clarity and accuracy. Seek feedback from a colleague to ensure the report makes sense. Then distribute it via channels where stakeholders expect to find it—email, Slack, Notion or your project management tool. Project Management Academy warns against hiding reports in obscure folders; if people need “Google Maps” to find your report, its value is lost.
- Iterate based on feedback. Ask recipients what they found useful and what they skipped. Adjust the length, cadence or content accordingly. Status reports are living documents; they evolve with the needs of your team.
Throughout this process, aim for brevity and clarity. Avoid jargon, keep paragraphs short and use simple language. When writing about design or technical details, translate them into business impact to ensure broad understanding.
Common mistakes and best practices
Mistakes
- Too much detail or too many pages. PlanAcademy cautions against overloading reports; keep it “short and sweet”.. A report that spans multiple pages and lists every task is likely to be ignored.
- Not tailoring to the audience. Dumping granular data on an executive or providing vague summaries to an engineering team both miss the mark. PlanAcademy emphasizes knowing your audience.
- Failing to highlight exceptions and deviations. UpperEdge stresses focusing on deviations from the plan rather than recapping routine progress. Without this, teams may miss early warning signs.
- Poor accessibility. Project Management Academy notes that if stakeholders struggle to find the report, they may assume you are hiding problems. Choose a central location and a consistent format.
- Creating the report in isolation. A status report should reflect the team’s collective understanding. Gather input from different disciplines, not just your own perspective. Project Management Academy suggests asking recipients what they actually read and need.
Best practices
- Start with purpose and audience. Clarify who will read the report and why you are writing it.
- Use clear status indicators. Instead of subjective color codes, provide factual statements like “on track” with supporting metrics.
- Include visuals and metrics. Charts or simple tables convey budget burn, velocity or milestone completion at a glance.
- Highlight what matters. Focus on milestones reached, upcoming tasks, issues and risks. Provide links for deeper details.
- Keep language simple. Avoid jargon and write in an active voice.
- Make it actionable. Include decisions needed, next steps and owners.
- Iterate. Adjust format and cadence based on feedback and team growth.
- Encourage transparency without blame. Use the report to align and solve problems, not to assign fault.
Template and example structure for startups
Here is a simple structure you can adapt. You can copy and paste these headings into your own tool.
- Header: Project name, reporting period, date, team name.
- Executive summary / health indicator: Overall status (on track, at risk, behind); one‑sentence overview of progress and issues.
- Progress since last report: Key milestones achieved, tasks completed and important metrics (e.g., % complete, budget spent).
- Upcoming tasks and milestones: List next steps with owners and deadlines.
- Issues, risks and blockers: Identify current problems, their impact and mitigation.
- Resource & budget update: Note major changes in resource allocation or budget usage.
- Stakeholder and team updates: Important announcements, dependencies, cross‑functional notes.
- Next steps / action items: Clear actions, owners and due dates.
- Attachments or links: Provide links to dashboards, backlog, design files or test reports.
Example scenario: Imagine you are leading Sprint 7 of a mobile‑app release. Your report might look like this:
- Project name: Mobile App V2 – Sprint 7
- Reporting period: 1–8 August 2025
- Executive summary: On track. UI screens completed; backend API delayed by two days due to supplier issues. Risk: delay could impact user testing.
- Progress: Design team delivered all UI screens; development completed authentication module; QA fixed five high‑severity bugs.
- Upcoming tasks: User‑testing scheduled for 10 August; development to integrate payment gateway; QA to run regression tests. Owner assignments listed.
- Issues: Backend API delay; mitigation: allocate one extra developer and reschedule user‑testing by two days.
- Resource/budget: Additional QA support needed for two days next week; budget remains within limits.
- Stakeholder update: Marketing team needs final screen designs for launch materials.
- Next steps: Confirm new user‑testing date; finalize API integration; update stakeholders.
Adapting this structure for different functions is easy. Design teams might include user research status or design backlog items; product teams could add experiment outcomes or roadmap alignment; engineers could report on code freeze status and technical debt.
When and how often to use status reports
Deciding on frequency depends on project complexity, stakeholder expectations and team size. Atlassian suggests that reports should be created often enough to keep everyone informed but not so often that they cause information fatigue. For early‑stage startups I recommend:
- Weekly updates for the core team and leadership. This cadence ensures continuous alignment without overwhelming the team.
- Bi‑weekly or monthly updates for board members and investors. They need a broader view, not day‑to‑day details.
- Daily reports only during intense phases, such as hackathons or critical product launches.
Align your reporting cadence with milestones. For instance, send a report after each sprint review or major design hand‑off. The key is consistency: pick a rhythm and stick to it, adjusting only when the project’s nature or stakeholder needs change.
Customising for design, product and tech teams
Different functions care about different details, so tailoring your report improves its relevance.
Design and product leaders
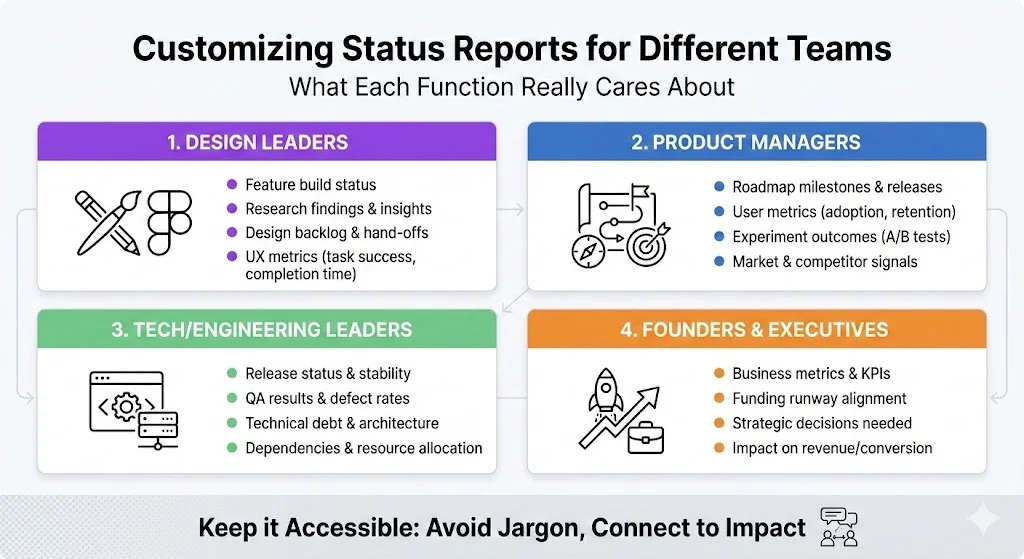
Design leads want to know how feature delivery aligns with user needs. Include:
- Feature build status: which features or components were designed or revised.
- Research findings: insights from user interviews or usability tests.
- Design backlog and hand‑off: upcoming designs, Figma hand‑offs and dependencies.
- UX metrics: indicators like task success rate or time to complete.
Product managers are concerned with roadmap alignment and user impact. In your status report mention:
- Roadmap milestones: where the project is in relation to planned releases.
- User metrics: early adoption numbers, retention or engagement metrics.
- Experiment outcomes: results of A/B tests or pilot features.
- Market or competitor signals: if relevant to prioritization.
Tech and engineering leaders
Engineers need visibility into code, deployment and risk. Include:
- Release status: which builds have been deployed and their stability.
- QA/regression results: test pass rates, number of defects found and resolved.
- Technical debt and architecture changes: highlight refactoring or platform shifts that affect velocity.
- Dependencies: coordination with other teams, libraries or external services.
- Resource allocation: distribution of developers across modules, and any capacity constraints.
Founders and PMs
Founders look for strategic insights. Connect the status report to:
- Business metrics: revenue, conversion, churn or other KPIs associated with the project.
- Funding runway: if the project’s timeline intersects with fundraising or board presentations.
- Strategic decisions needed: such as whether to pivot features, increase headcount or adjust budget.
Regardless of the audience, the tone should be accessible. Avoid technical jargon and explain how design or engineering work translates into user or business impact.
Conclusion
Understanding what a status report is reveals that it is more than a box to check—it is a vital tool for making sense of complex work. It provides a shared snapshot of project health, tracks progress against the plan, aligns teams across disciplines and surfaces risks before they become crises. Regular, thoughtful reports build a history of decisions and outcomes that improves future planning and fosters trust.
For early‑stage startups and product teams, adopting a consistent status‑reporting practice can have a meaningful impact on clarity, alignment and stakeholder confidence. By using the template and guidelines provided here, you can tailor reports to different audiences, highlight what matters and make better decisions. Try implementing a weekly cadence, refine it based on feedback and watch how much smoother collaboration becomes. By now you should understand its purpose and why it matters.
FAQ
1. What is a status report?
It is a document that summarizes where a project stands at a specific point in time compared with the plan. It includes key information such as milestones achieved, tasks in progress, risks, resource allocation and next steps. Its purpose is to give stakeholders a clear snapshot of the project’s health so they can make informed decisions.
2. What are the three types of status reports?
They are generally classified by frequency: daily, weekly and monthly (with quarterly used for higher‑level summaries). Daily reports provide brief task updates; weekly reports offer more detail and context; monthly reports give an in‑depth review including budgets and long‑term trends.
3. What is the difference between a progress report and a status report?
A progress report focuses on work completed and advancements over a period of time, detailing tasks done, milestones achieved and future plans. A status report provides a snapshot of the project’s current state, including progress, issues and next steps, comparing the current state with the plan.
4. Why are status reports important?
They ensure transparency and alignment, track progress, highlight issues early, communicate tasks and resource allocation, and build a historical record. Regular status reporting allows teams to make informed decisions and adjust course before small issues become major problems.

check out these related blogs