When you’re running an early‑stage company, it’s easy to lose your footing amid releases, fundraising and hiring. You need a clear view of how your product and business are doing. What is performance reporting? It’s a process for collecting, analysing and presenting evidence about how projects or products are performing. This short guide explains why it matters, how to do it and what founders, product managers and design leaders can learn. Along the way we’ll connect performance reports to business analysis and the skill of choosing the right KPIs.
What is performance reporting?
Performance reporting turns raw numbers into insight. In product and project contexts it means gathering metrics on progress, costs, usage and outcomes, comparing them to expectations and sharing the story with stakeholders. The Nielsen Norman Group says that UX benchmarking uses metrics to gauge a product’s performance against a meaningful standard. In our practice, performance reporting follows the same logic: define what matters, measure it and interpret the results. Reporting differs from measurement because it adds context and narrative.
When teams ask what is performance reporting, I tell them it’s how we stay honest. Without baseline numbers you can’t tell if a redesign helped or hurt. A good report ties usage and revenue to the goals you set. It also prompts deeper questions when results don’t match expectations. Early‑stage teams, in particular, benefit from this discipline because intuition alone often misleads.
Why it matters for startups and product teams
Young companies move quickly. Product managers need to know which features users activate and how long it takes to see value. Designers need evidence that a new flow reduces friction. Founders want to see how growth and costs interact. Reports answer these questions. Asana defines data‑driven decision making as collecting data based on your company’s KPIs and converting it into actionable insights. Being data‑driven means using facts rather than emotion.. Reports support this discipline and build trust across the team.
The stakes are high. Baymard’s research shows that 32% of customers would leave a brand they love after a single bad experience, and Forrester found that frictionless experiences can raise conversion rates by up to 400%. Without reports to surface problems, you risk losing users and revenue. For product‑led businesses, connecting adoption metrics to business outcomes is essential. The Userpilot benchmark notes that onboarding checklist completion stands at about 24.5% for Fintech and insurance products, while core feature adoption is about 31% for HR tools. These numbers spotlight where teams need to focus.
Essential components of performance reporting
Understanding what is performance reporting means looking at its building blocks.

1) Define objectives and pick KPIs
Start with a clear aim. Are you trying to boost activation, shorten time to value or improve retention? Translate that aim into measurable indicators. In SaaS, typical KPIs include activation rate, month‑one retention, feature adoption, onboarding completion and Net Promoter Score. Pick a few that tie directly to your goals. The Innerview guide warns against vanity metrics like social media followers because they don’t drive real growth.
2) Collect data and track financial health
Gather data from product analytics tools, billing systems, marketing platforms and customer feedback. Use a universal reporting tool to pull these data sources into one place. For financial health, watch gross profit margin, return on investment and recurring revenue. Ensure consistency in definitions and timeframes so that comparisons are valid.
3) Visualise and summarise
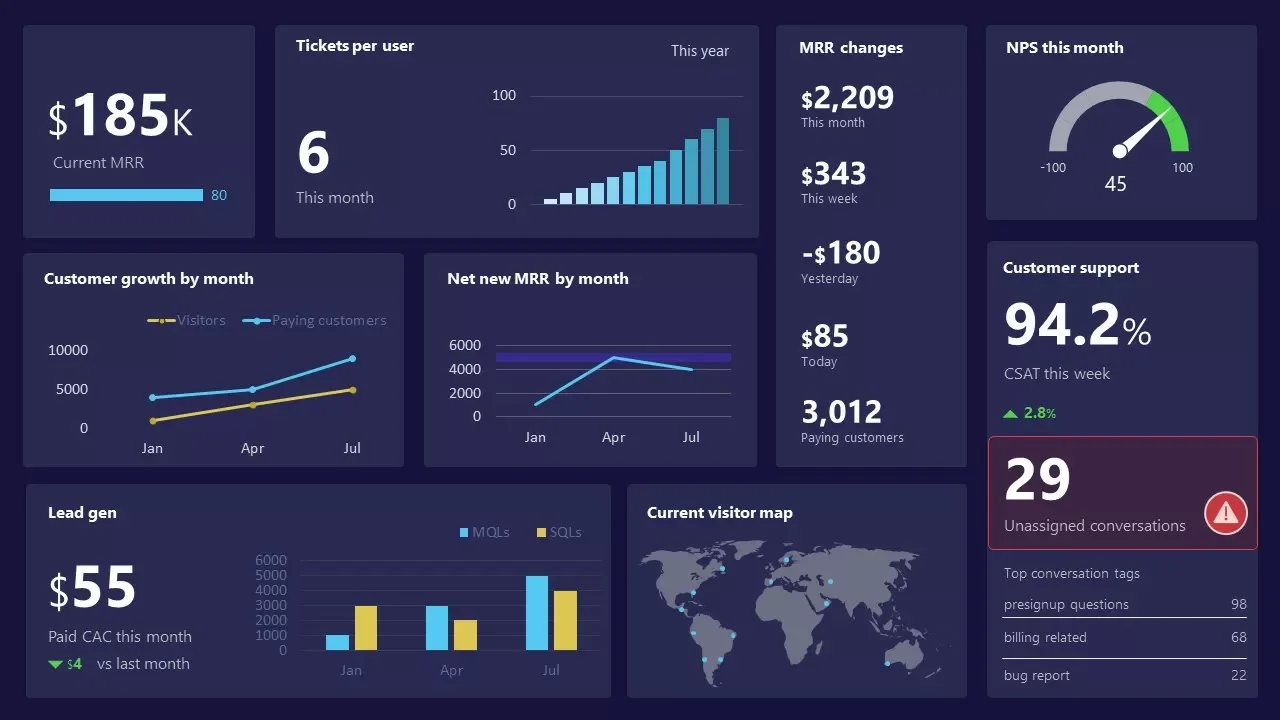
Visualisation helps stakeholders grasp patterns quickly. Business intelligence tools simplify data visualisation for non‑technical people. Use line charts for trends and bar charts for comparisons. An executive dashboard can display only the metrics that matter most. For product teams, a product analytics dashboard should break down feature usage and drop‑off points.
4) Evaluate performance and communicate
Once data is visualised, compare actual results to targets and look for trends, anomalies and variances. Ask why metrics changed. When sharing reports, adjust the depth of detail to your audience. Executives need high‑tier summaries, while product teams need detailed breakdowns. Avoid dumping raw data; interpret it and propose actions. Effective communication turns numbers into decisions.
Types of performance reports
Different reports serve different needs. Knowing which one to use is part of understanding what is performance reporting.
- Status reports demonstrate what has been done, what’s next and any blockers. They are useful for weekly or sprint check‑ins.
- Trend reports demonstrate how metrics change over time. They help identify improvements or declines over months or quarters.
- Variance reports compare planned and actual values for budget, schedule or scope. They show overruns and underperformance.
- Forecasting reports use current and historical data to predict future performance, such as revenue or churn.
- Specialised reports focus on areas like marketing, web or product. Each report tracks metrics relevant to its domain.
Choose the report format that answers your audience’s questions without overwhelming them.
How to do performance reporting: six steps
If you’re still wondering what performance reporting is in practice, follow these steps.
- Define your audience and purpose. Identify who will read the report and what they need to know. Set the scope accordingly.
- Set objectives and choose KPIs. Specify your goal and select a handful of indicators that measure progress toward it. Avoid vanity metrics.
- Collect and organise data. Pull data from all relevant sources, ensuring quality and consistency. Clean and normalise it before analysis.
- Analyse and interpret. Compare actual results to targets. Look for trends and anomalies. Ask why metrics changed and dig deeper if necessary.
- Communicate clearly. Craft a narrative that states what happened, why it matters and what you propose to do. Use visuals and adjust detail for each audience.
- Review and iterate. Establish a reporting cadence and refine your metrics over time. Many organisations recognise that their KPIs need improvement and some invest in smarter metrics. You can start small by reassessing your metrics every quarter.
Best practices and common pitfalls
Best practices
- Measure what matters. Focus on a handful of metrics tied to your objectives.
- Use visuals. Charts and dashboards help people see patterns quickly.
- Connect metrics to outcomes. Show how changes in adoption or retention affect revenue or costs. Poor experiences can drive users away.
- Engage stakeholders. Involve team leads and executives when selecting metrics so that they care about the results.
- Automate. Use tools to gather and visualise data so you can focus on analysis.
- Iterate. Revisit your metrics and reports regularly and refine them as goals change.
Common pitfalls
- Tracking too many metrics. Too much data dilutes attention.
- Reporting without action. Reports should inform decisions, not just document history.
- Poor data quality. Inconsistent definitions and missing data erode trust.
- One‑size‑fits‑all communication. Adjust detail and language to your audience.
Performance reporting for startups
Startups face unique constraints. Resources are limited, so prioritise the metrics that matter most to survival, such as activation, retention and recurring revenue. Adopt shorter reporting cycles—weekly or bi‑weekly—to catch issues early. Standardise definitions from the start, even if you begin with spreadsheets. Link design and product metrics to business outcomes; if a new flow improves adoption but increases churn, investigate why. When reporting to investors, prepare a concise recap. When reporting to your team, provide more depth. The MIT research shows the importance of refining metrics over time to improve outcomes.
Tools and templates
Choose tools that suit your scale and budget. When selecting tools, asking yourself what is performance reporting can help you focus on features that turn data into insight. Product analytics platforms capture user behaviour, feature usage and adoption flows. Business intelligence tools aggregate data from multiple sources and provide dashboards. The Userpilot benchmark suggests tracking activation rate, time to value, retention, feature adoption, onboarding completion and Net Promoter Score. A simple template should include an executive recap, a dashboard of metrics, an interpretation section and a next‑steps section. Keep visuals simple and focus on clarity.
Case example: ProdFlow
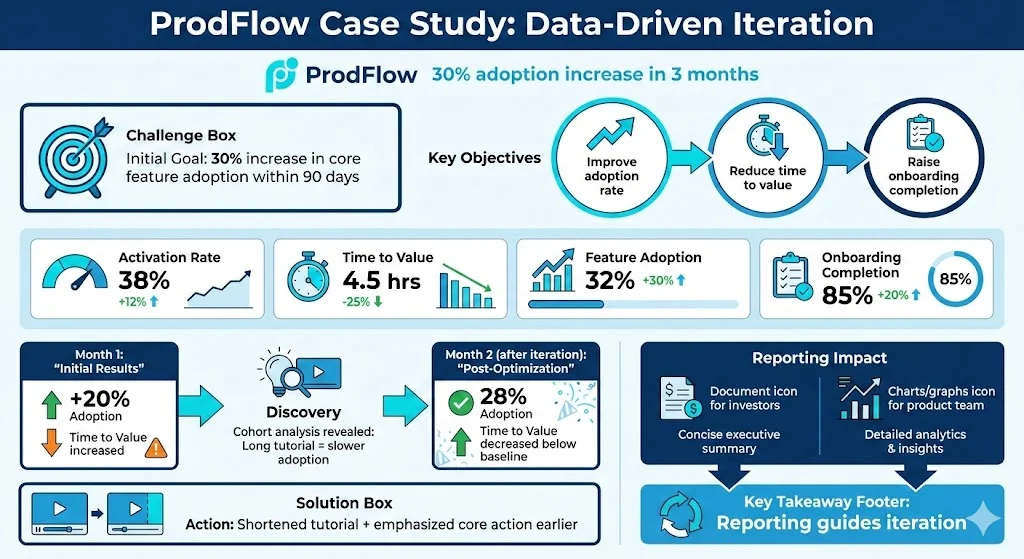
A fictitious SaaS company, ProdFlow, aimed to increase core feature adoption by 30% in three months. The founder set clear objectives: improve adoption, reduce time to value and raise onboarding completion. They chose activation rate, time to value, feature adoption and onboarding completion as KPIs. Data from their product analytics and billing system showed that adoption improved by 20% but time to value increased. A cohort analysis revealed that users watching a long tutorial were slower to adopt the feature. The team shortened the video and emphasised the core action earlier. In the next month, adoption climbed to 28% and time to value dropped below the original amount. The report they prepared included a concise recap for investors and detailed charts for the product team. This example illustrates how reporting guides iteration.
Conclusion
To recap, what is performance reporting? It’s the discipline of turning data into insight so that you can make better decisions. In early‑stage companies, clear metrics and honest reporting beat guesswork. By defining objectives, picking meaningful indicators, collecting and analysing data, and communicating findings, you give your team the clarity it needs to build the right product. Start small: choose one metric, build a simple report this week and use it to learn. As research shows, smarter metrics lead to better outcomes and poor experiences can drive users away. Use reporting to keep your company focused and to build products that users will stick with.
FAQ
1. What is an example of a performance report?
A monthly product report might include activation rate, time to value, retention, feature adoption and recurring revenue. It would open with a brief recap, demonstrate a dashboard of metrics, discuss trends and variances, and suggest actions. A project status report might summarise completed tasks, budget used, schedule variance and next steps.
2. How do you perform performance reporting?
Follow six steps: define your audience and purpose; set objectives and pick KPIs; collect and organise data; analyse and interpret; communicate clearly; review and iterate. Each step ensures that the report is relevant, accurate and useful.
3. What is business performance reporting?
Business performance reporting looks at the organisation as a whole. It uses financial metrics like gross profit margin and recurring revenue, operational metrics like productivity, and customer metrics like satisfaction and retention. The goal is to inform leaders and investors about how the business is performing and where to focus resources.
4. What are performance reporting services?
Performance reporting services include software platforms that collect data and generate dashboards and consulting services that interpret and present findings. These services can automate data gathering, create visualisations and provide expert analysis. Examples include product analytics tools, business intelligence platforms and agencies that prepare board reports.

check out these related blogs